| Results |
||
| Home
Abstract Project Motivation Coastal Environment
|
The results of this wind-wave
analysis are summarized below. The original spreadsheet calculations
done in Excel are not included here.
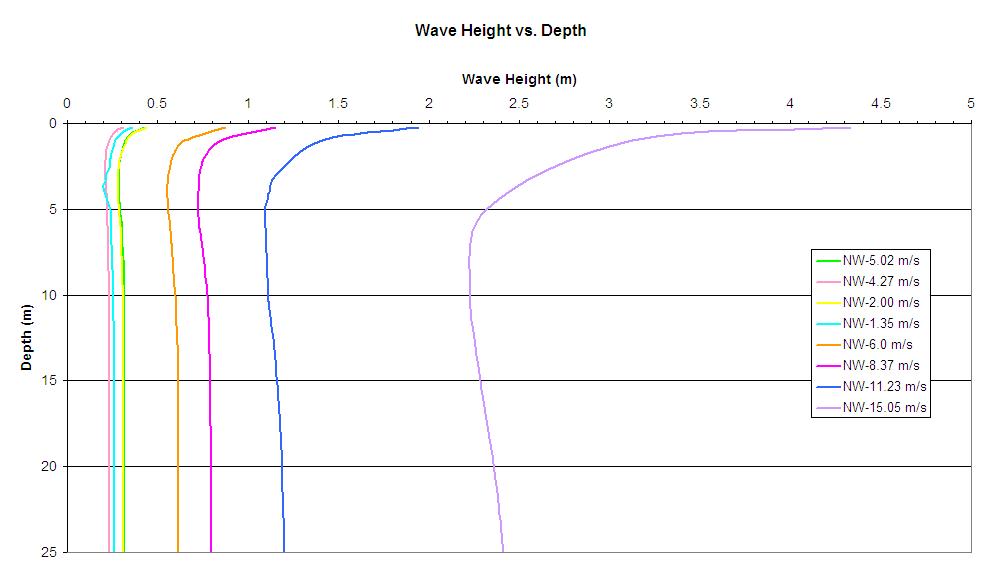
Below is a plot of wave height versus depth for the various wind speeds from the northwesterly direction through the period of June through September 2003. It should be noted that at all wind speeds, the waves did break. According to the geometric criteria, at the lower wind speeds, the breaking occurred at depths between 0.25 and 0.5 m. At the higher wind speeds, the waves broke at depths ranging from 1.0 to 2.0 meters. The typical reduction in wave height occurred at a depth of approximately 5.0 meters and was followed by the sharper increase in wave height as the wave moved inland (depth decreased).
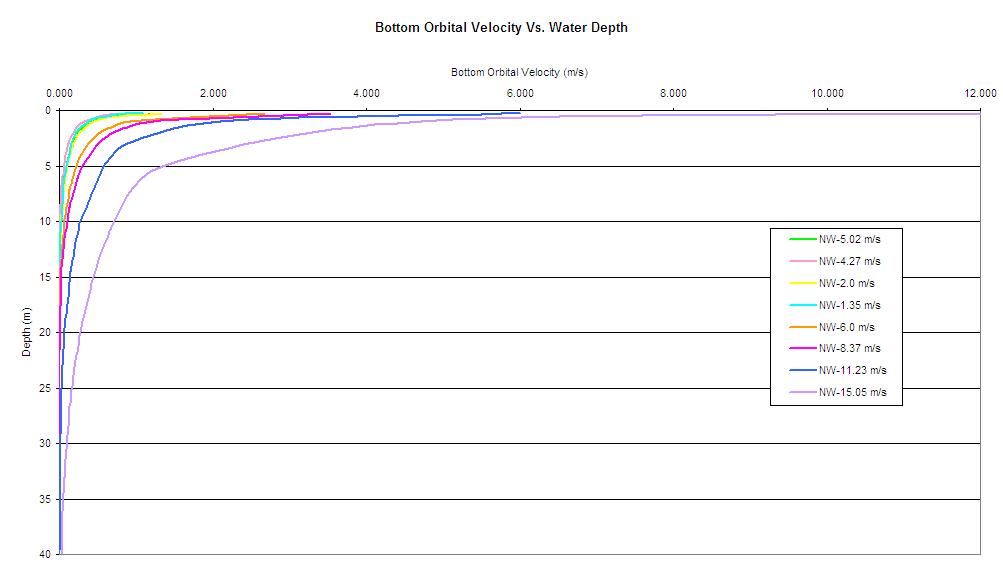
The second plot shows how water depth and wind speed affect the bottom orbital velocity. As mentioned before, the bottom orbital velocity of the wave is related to the resuspension of particles on the bottom. When the bottom orbital velocity exceeds the critical orbital velocity, then particles will begin to resuspend in the water column. This plot demonstrates how strong winds (wave heights) can affect bottom sediments at a much greater depth than mild winds. The wave's orbital velocity is related to wave height, water depth, and wave period. The critical orbital velocity needed to resuspend particles is dependant on particle density and diameter as well.
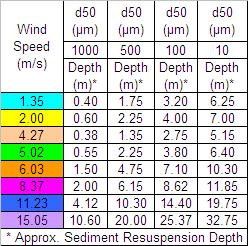
The table below summarizes the depths of resuspension at the various wind speeds and particle diameters. These values are approximate and were obtained by iterations to one-tenth of a meter or better.
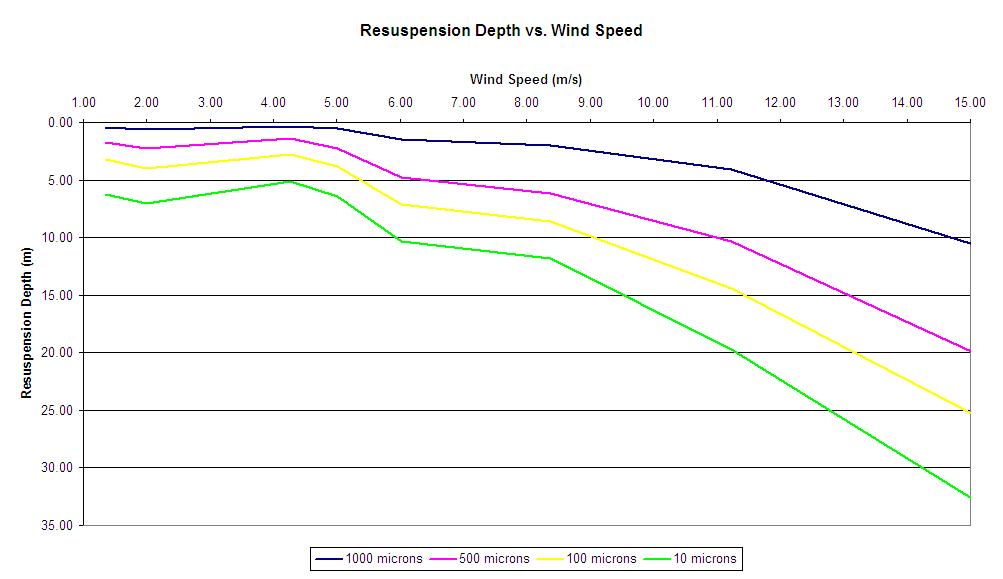
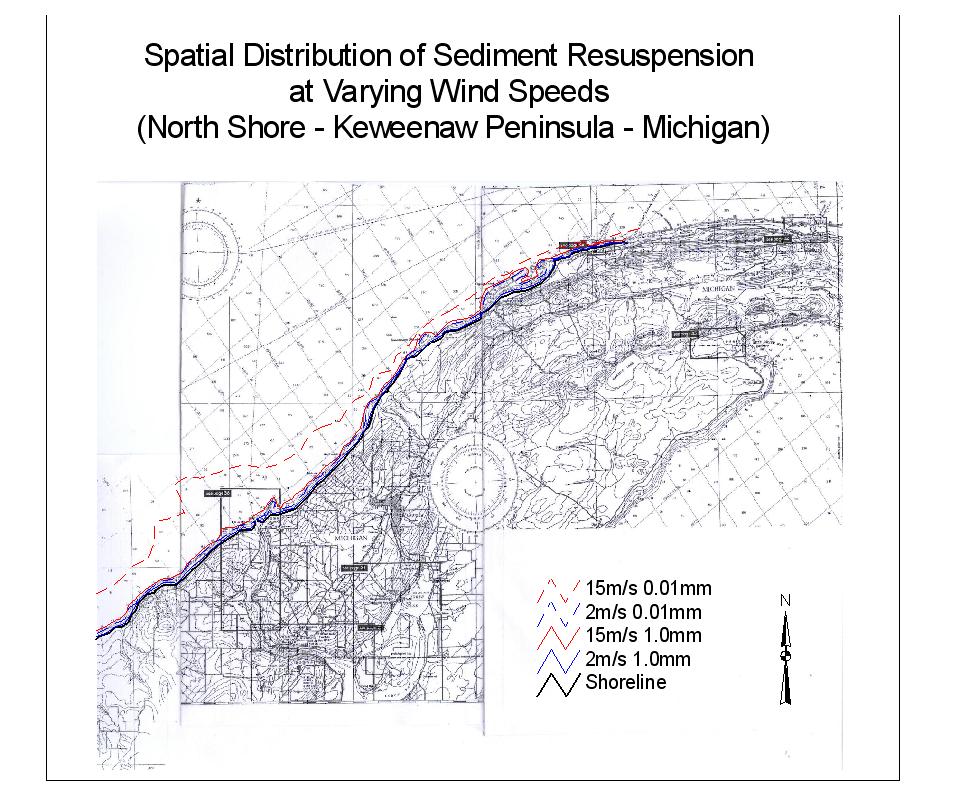
The above chart relates wind speed and resuspension depth. Each line represents a given particle diameter. As you can see, wind-waves more greatly affect the finer sediments and at greater depths. For finer materials, winds in excess of 15.0 m/s can affect resuspension at depths greater than 30.0 m. Using the calculated resuspension depths for the various particle sizes and wind-speeds, a spatial comparison can be done and zones of particle resuspension can be created along the north shore of the Keweenaw. This plot was created using scanned images of the NOAA bathymetric chart for Lake Superior as well as ArcView 3.2. A comparison was done between particles of diameters 1000μm and 10μm as well as at wind speeds of 2 m/s and 15 m/s. The image below displays the results.
It is very clear that particle size and wind speed are very importance factors in the ability of particles to become resuspended. The greatest area of resuspension occured with the 10μm particles at the 15.0 m/s wind speed. At lower wind speeds, the resuspension zone is very narrow and remains very near to shore. Even at high wind speeds, the resuspension of 1000μm particles did not have a large spatial distribution. |