
Modeling and AnalysisBecause of the large area of the algae farm
and relatively
shallow water (5 feet or less), a true scale model was not able to be
created. As a result we focused on
modeling the overall shape of the algae farm and the input and outputs
of the
system. By focusing on this aspect we
could observe how the water would flow in the algae farm, and how the
system
would respond to higher than normal flow rates from the Actual Design #2 Dimensions 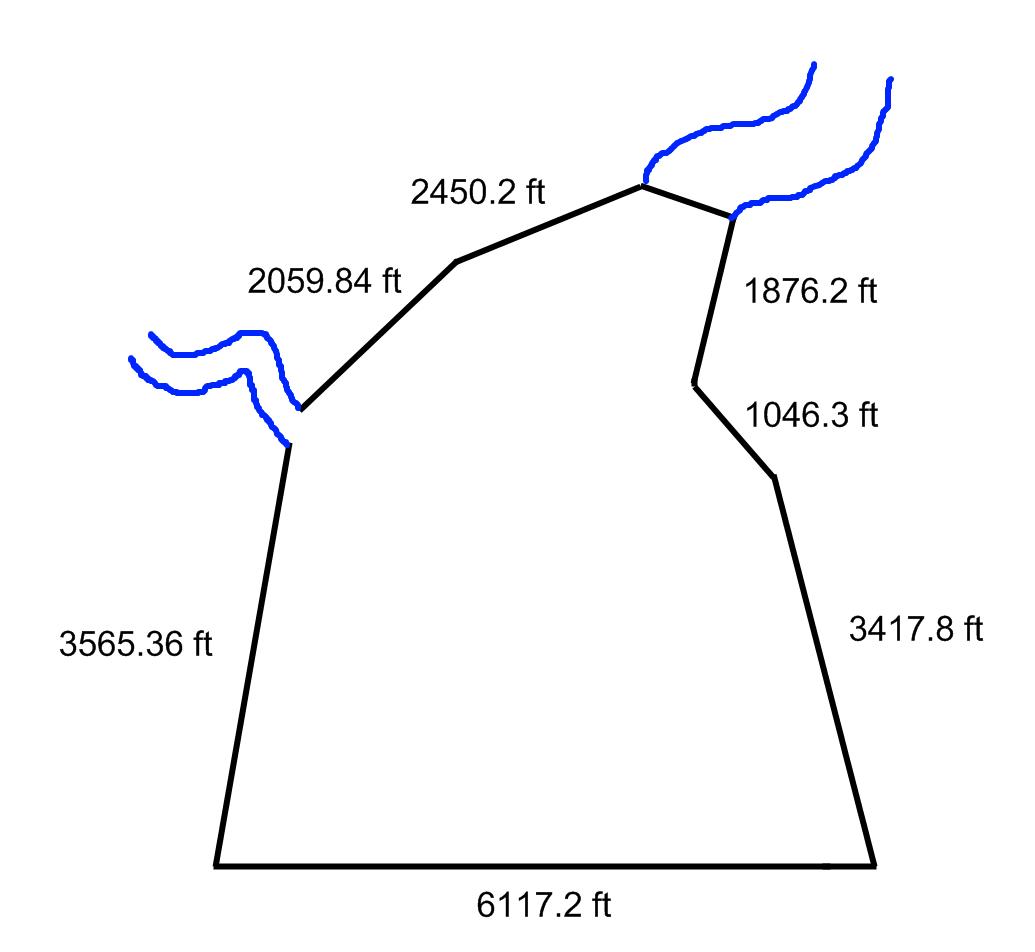 Modeled Design #2 Dimensions 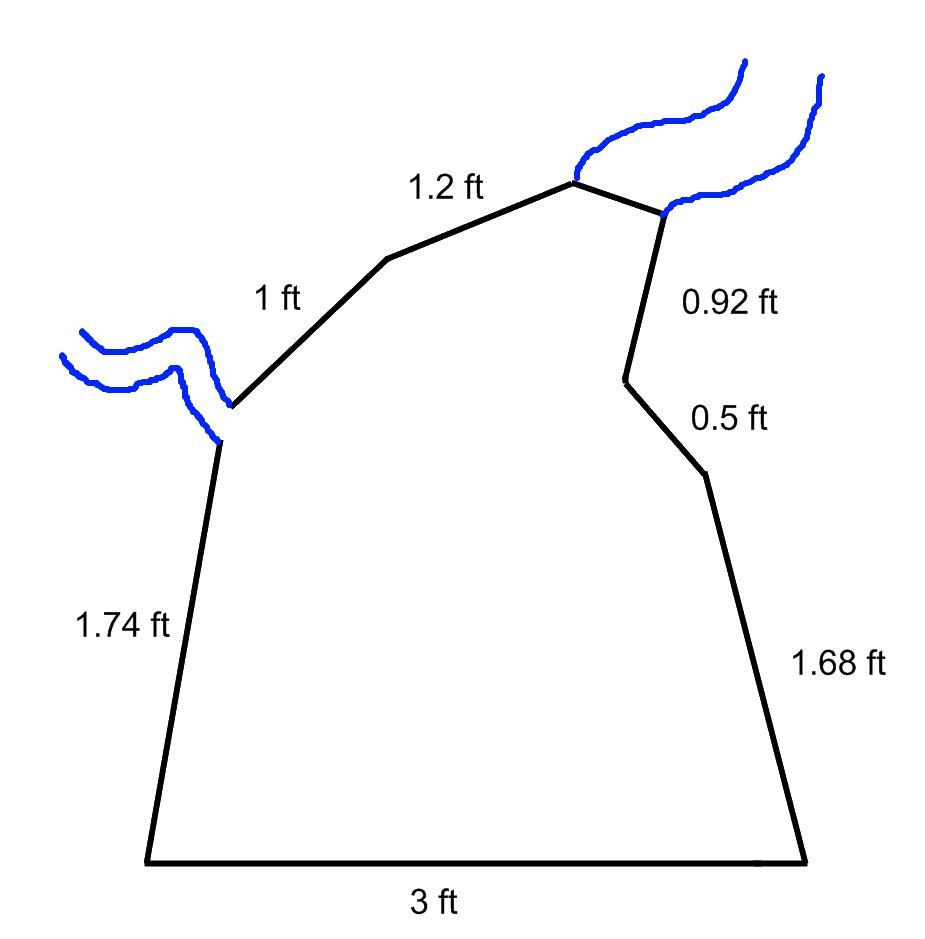 Actual Cross Sectional Areas Dorn Creek = (72 ft) * (3 ft) = 216 ft² Area of the wall = (6117.3 ft) * (5 ft) = 30,586.5 ft² Modeled Cross Sectional Areas (using a scaling factor of 247) Yahara Dorn Creek = (0.25 in) * (2 in) = 0.00694 ft² Area of the wall = (3 ft) * (2 in) = 0.5 ft² Actual Discharge Rates Peak Total Discharge of Yahara River and Six Mile Creek = 1450 ft³/sec Modeled Flow Rates (using a scaling factor of 247) Peak Total Discharge of Yahara River and Six Mile Creek = 9.59E-5 ft³/sec or 2.71 cm³/sec * During our model flow discharge calculations there was an error in our calculation and thus the discharge rate that was performed during the modeling process was incorrect. We will expand on this issue later in the Modeling and Analysis section. For the time being, below is the corrected calculation of the model discharge rate needed for our model. Corrected Model Discharge Rate Instead of using the scaling factor of 247, as was used above to determine the discharge rate, we applied the dynamic property of a Froude number to determine the model discharge rate. Velocity of Model = (Lenth of Model / Length of Actual)^(0.5) * (Velocity of Actual) Actual velocity with 2002 peak discharge of 1450 ft³/sec and cross sectional area of 650 ft² at measurement locality Vact = (1450 ft³/sec) / (650 ft²) = 2.23 ft/s Length of Model / Length of Actual = 1/247 Velocity of Model = (1/247)^(0.5) * (2.23) = 0.142 ft/sec Area of Yahara input of Model = 2 in x 1 in = 0.01389 ft² Corrected Model Discharge Rate = Area * Velocity = (0.142 * 0.01389) = 0.00197 ft³/sec or 55.8 cm³/sec *To be used in future modeling analysis Modeling Trials During our modeling, we performed the following three trails: Video of Trial #1Our first modeling trial essentially failed due to excessive leaks within the model. We also didn’t control the model output discharge rates of the Yahara River and Dorn Creek. While many things went wrong, trial one was not a complete failure. It proved that water can be discharged through the wall and we observed the dynamic flow of the system. Video of Trial #2 Before our second trial we water proofed the model and prepared a system to provide the model peak flow rate of the Video of Trial #3 For the third trial, we attempted to determine the maximum model input flow that would cause overtopping of the wall. However we were unable to provide a flow that could do this and had to settle with the maximum flow produced by the faucet, which was 309 ml/sec or an actual discharge rate of 8019.99 ft³/sec. *Calculation of the maximum discharge value above was done using the reverse calculation of the Corrected Model Discharge Rate from above. 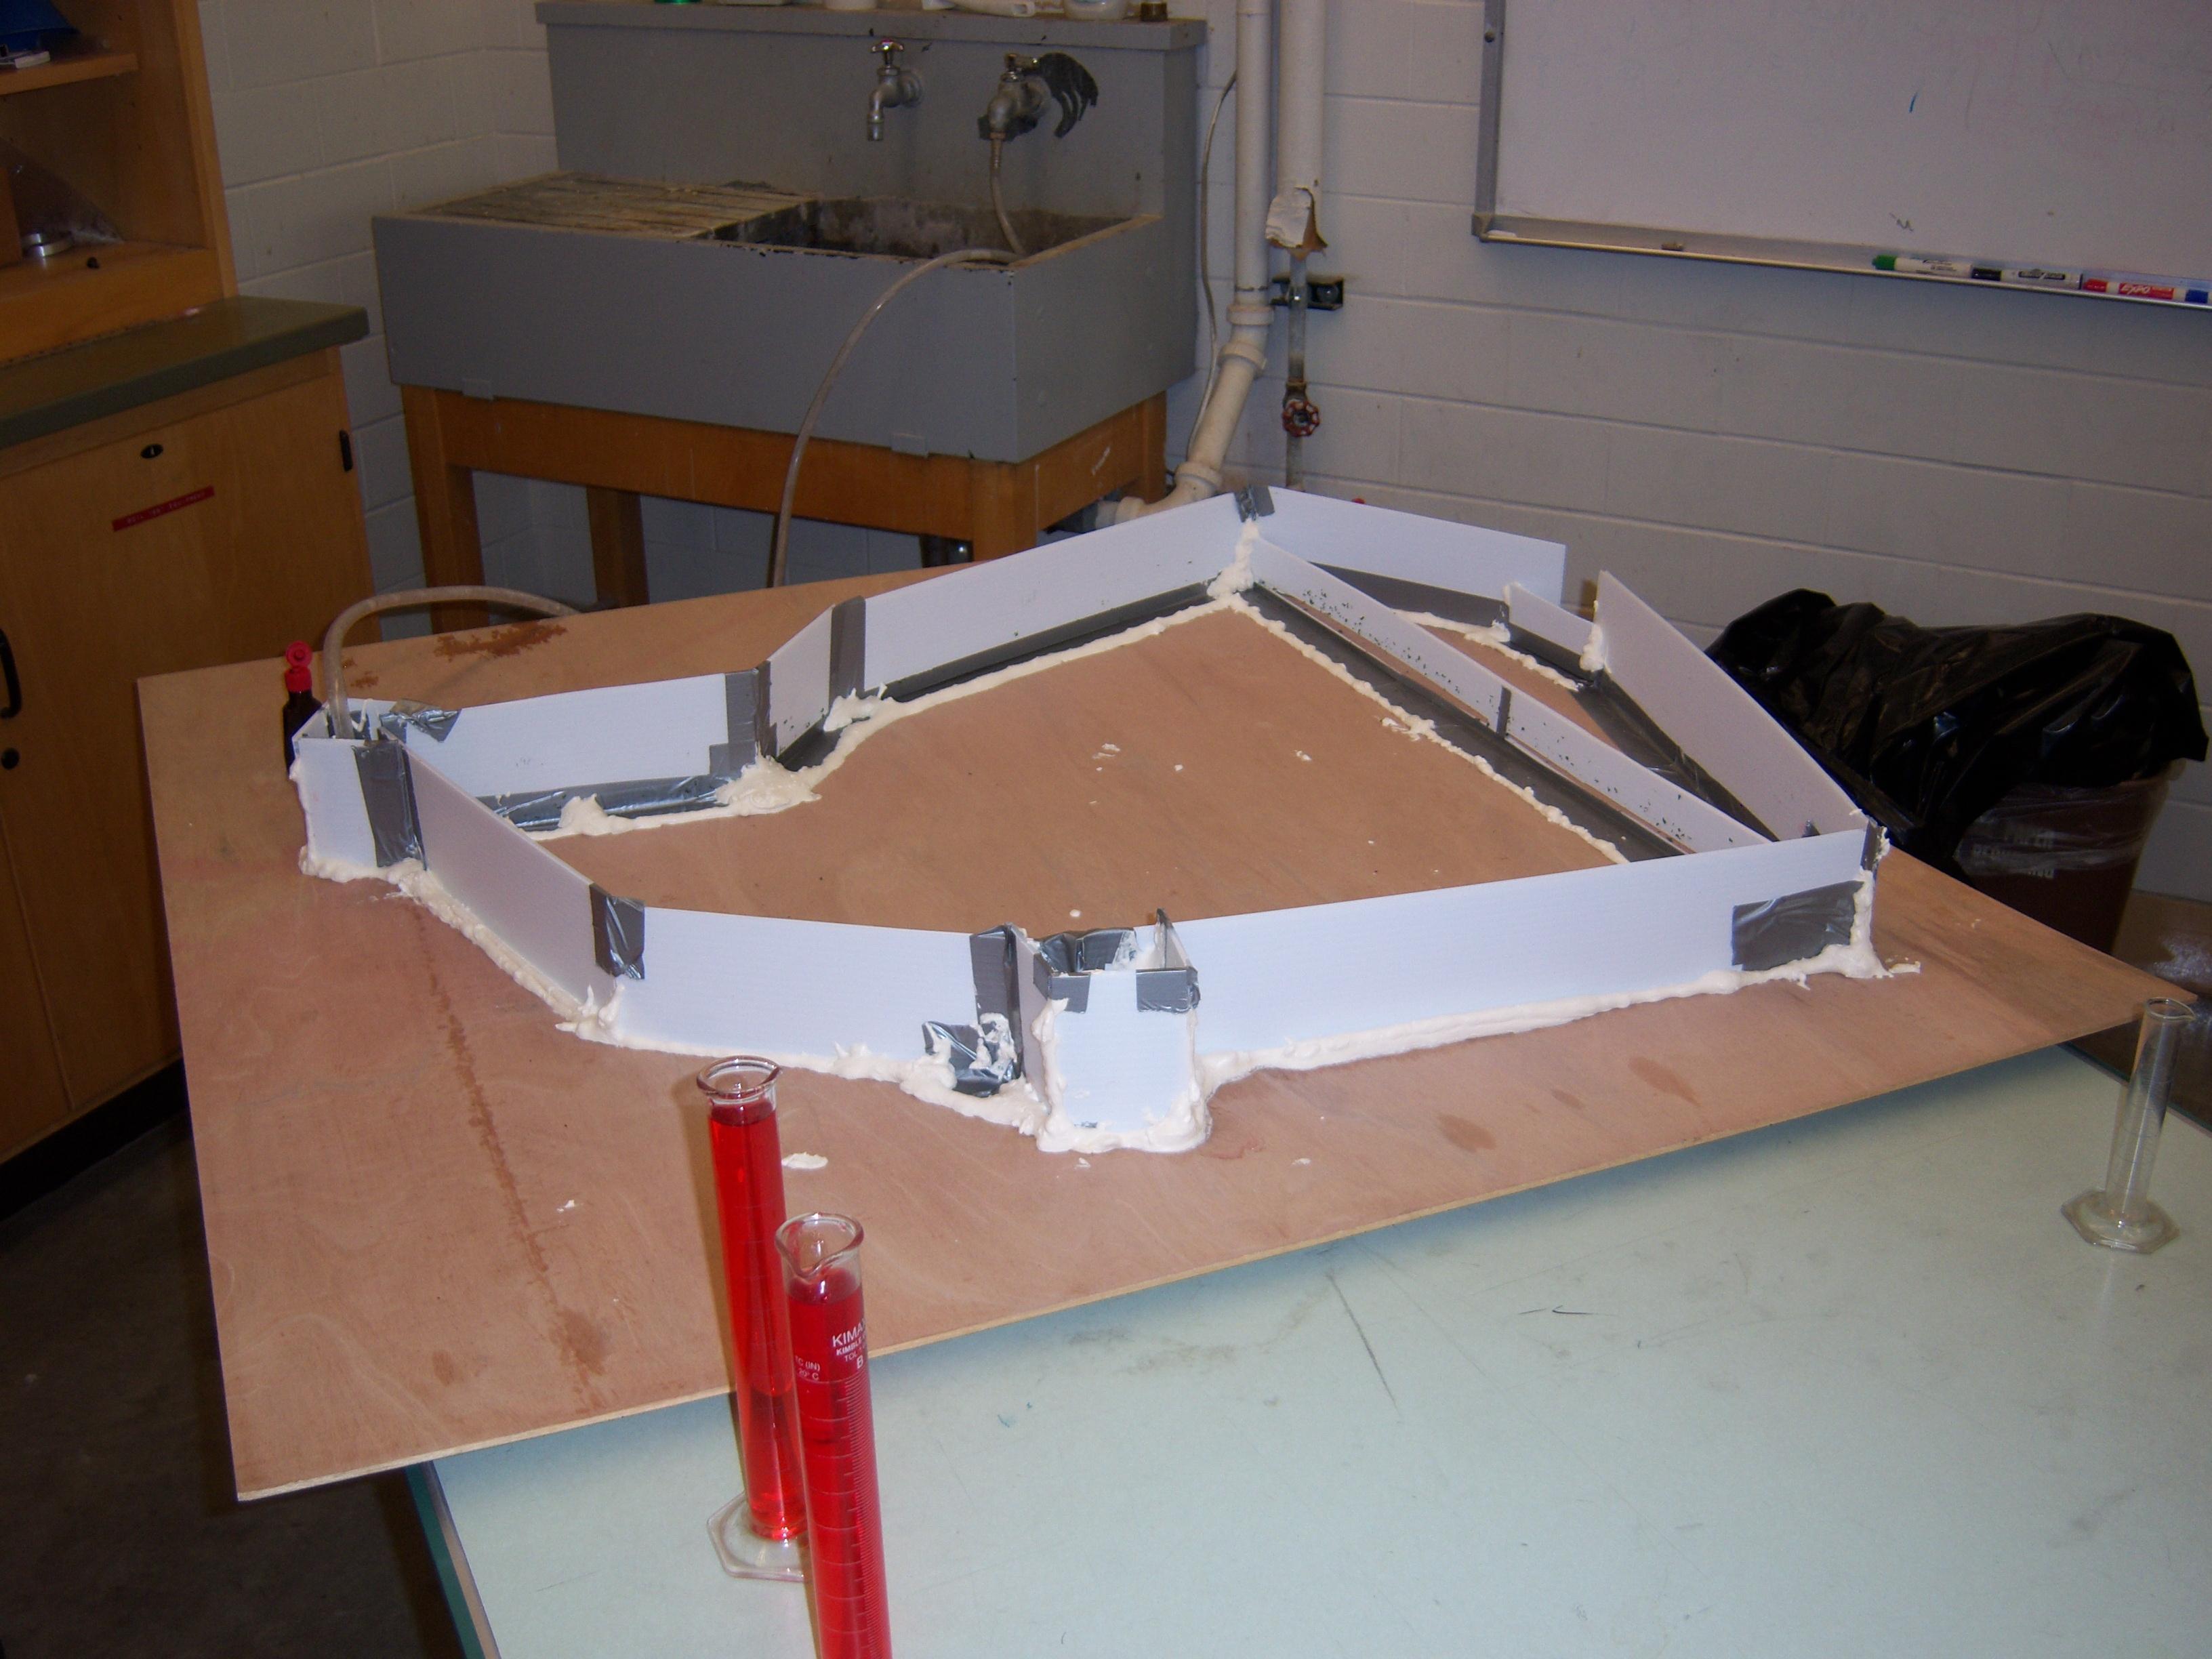 Model Before Trial # 2  Filling up the Model 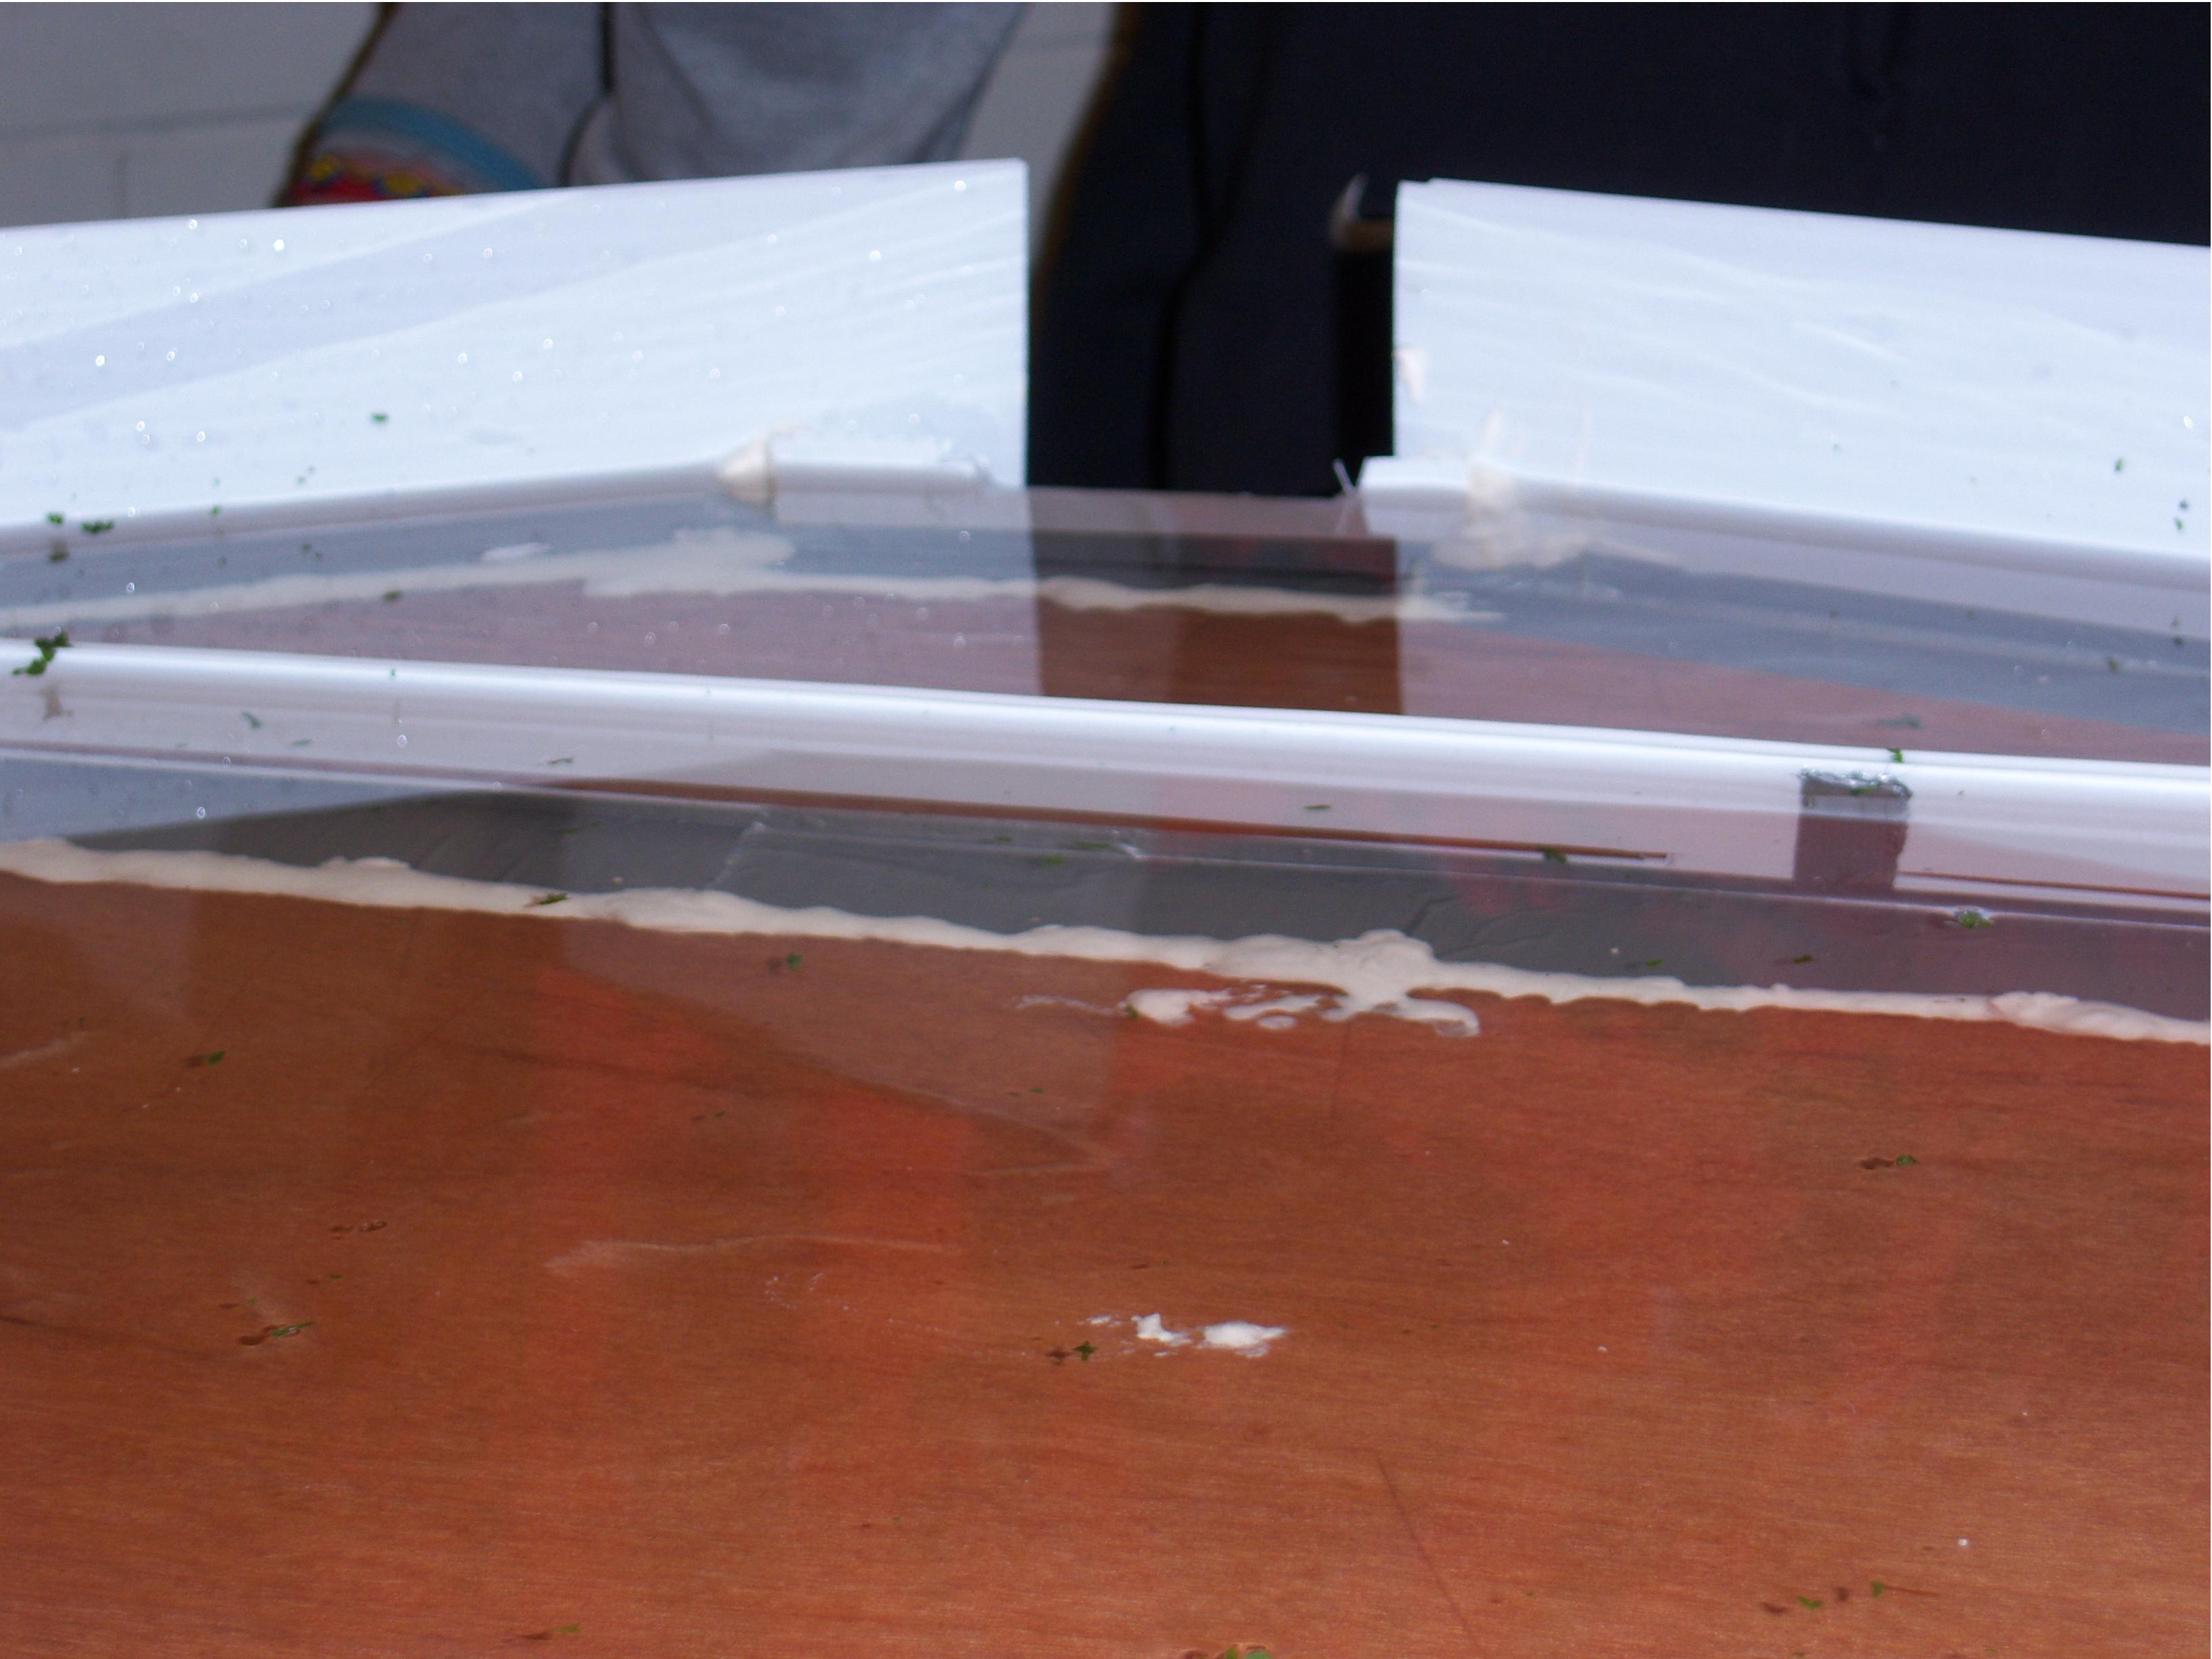 View of the algae barier wall with water near the top of the surface.  View loocking down the barrier and algae being contained  Modeling the flow of the system  Alternative view from picture above. Notice minimal leaking. Picture taken 10 minutes after starting. What we learned
|
|