Investigation of two Modeling
Programs:
Surface
Water Modeling System (SMS)
Steady-State
Spectral Wave Model (STWAVE)
Lindsey Bergsven
Chris Doll
CEE 514 – Coastal Engineering -
Fall 2006
The main goal of our project was to portray wave diffraction, refraction, and deflection in Sheboygan Harbor. We wanted to look at the effects that waves coming from different directions would have on the harbor's overall wave heights. In order to do this, we sent wave propagation's from three different directions using STWAVE.
The directions we chose were 45 degrees from horizontal going south (i.e. Southwest waves), a wave 0 degrees from horizontal (i.e. West waves), and 75 degrees from horizontal going north (i.e. Northwest waves). We chose these directions because they allowed us to examine the effectiveness of the harbor no matter where the waves were coming from, and also because we thought they would produce the highest wave heights in the harbor. We also modeled currents (1.2 m/s and .11 m/s) coming out of the Sheboygan River in the 0 degree case, and compared it to the results obtained when there was no current.
The Model Wave
Each direction was given the same initial wave properties, those being significant wave height and period. We chose a wave height of 2 m and a period of 5 seconds. The values were obtained from the NOAA buoy data (Station 45007) and were selected based on the graphs seen below. We chose these values from the November month, as it produced the largest waves.

Figure 8: Significant Wave Height (Source: http://www.ndbc.noaa.gov)

Figure 9: Average Wave Period (Source: http://www.ndbc.noaa.gov)
Modeling
The first step in analyzing the situation in the Sheboygan harbor was to model the area in SMS. SMS allows the user to take a bathymetry data set of any coastal environment and make a 3-D surface model of the topography, commonly referred to as a Mesh. With the help of Josh Anderson, a former Coastal Engineering student, we were able to obtain the data necessary for the creation of the Sheboygan Harbor Mesh. A picture of the mesh we used to model the Sheboygan Harbor can be seen below. The deeper areas are indicated by the red color and the shallow areas are indicated by the blue color.

Figure 10: Sheboygan Mesh
>From the Mesh, we were able to create a Cartesian grid of the area. This grid is necessary for input into the STWAVE program. The process of converting the mesh to the Cartesian grid was rather easy, and was able to be done in the SMS interface. A picture of the Cartesian grid can be seen below. Each individual grid cell is given an elevation interpolated from the Mesh. This allows the program to model wave refraction as waves propagate over changing depths. In the grid, land is modeled brown and has a default elevation of 2 m above sea level.

Results
(Note: Arrows on diagrams represent wave direction)
Southeast Wind: Wave Height = 2
m, Wave Period= 5 s

Figure 12: Southeast wind: Wave Height
Discussion
As seen from the figure above, relatively intense waves of about 1 meter in height are able to penetrate into the harbor (green), but they are reduced by the interior breakwater. It is reasonable to assume that the breakwaters were placed in these regions to help dissipate these larger waves capable of penetrating the initial breakwaters. We also see that the breakwater on the south side does a very good job at reducing the wave height to almost zero, making for a calm harbor. Overall, we see that the shoreline is very stable with little to no waves penetrating into the interior of the harbor.
Northeast Wind: Wave
Height = 2 m, Wave Period=
5 s

Figure 13: Northeast Wind: Wave
Height
Discussion
The waves coming out of the North have very little effect on the interiors of the harbor due to the presence of the breakwater on the north side. The largest wave entering the harbor is around 1 m and is quickly dissipated before reaching the interior of the harbor. Again, the interior of the harbor is very calm with relatively zero wave height. Also notice that some of the waves, around .3 meters in height, are able to penetrate to the shore near the mouth of the river.
East Wind: Wave Height = 2 m, Wave Period= 5 s 
Figure 14: East Wind: Wave
Height Discussion
Waves propagating directly out of the east also bring waves of somewhat significant height into the interior of the harbor. Waves of 0.7 meters reach the interior breakwater, where they are again dissipated by its presence. Waves again are able to reach the river inlet, and have a height around 0.4 meters.
East Wind with Eastward Current (1.2 m/s): Wave Height = 2 m, Wave Period= 5 s

Figure 15: East Wind with Eastward current (1.2 m/s): Wave Height
Discussion
In the figure above, a current of 1.2 m/sec traveling east (current due to 100 year storm found courtesy of Josh Anderson) was input into the simulation to represent the current that would be coming out of the river. The current reduces the wave height near the river mouth, and entering into the harbor, as can be seen by comparing the two figures above. The maximum height entering the harbor is now only around 0.9 meters, whereas it was around 1.4 meters with no current. However, once again the near shore wave height is relatively small if not zero, allowing for a calm docking and navigation area. Finally, we conclude that when the current is greater than or equal to the group velocity of the waves, Cg, the current overpowers the energy of the waves and diminishes the wave height. Therefore, we looked at a case where the current was less than the group velocity (see Figure 16).
East Wind with Eastward Current (.11 m/s): Wave Height = 2 m, Wave Period= 5 s
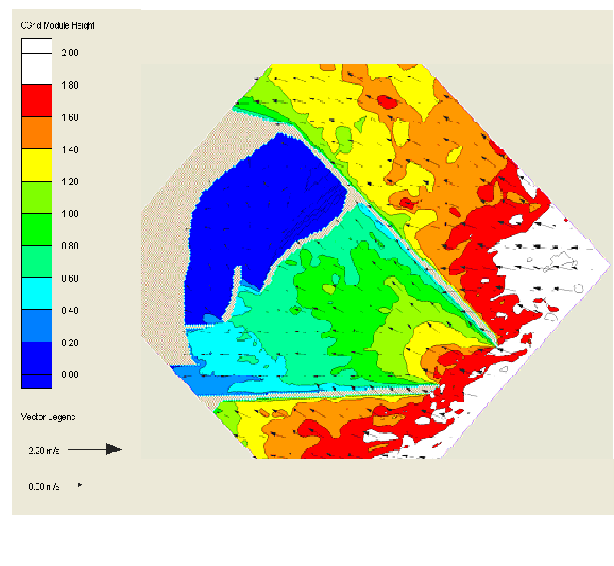
Figure 16: East Wind with Eastward Current (.11 m/s): Wave Height
Discussion
In the figure above, a current of 0.11 m/sec traveling east was input into the simulation to represent the current that would be coming out of the river in the event of a winter storm where there is no rain. The current increases the wave height near the river mouth, and entering into the harbor, as can be seen by comparing figures 16, 15, and 14 above. The maximum height entering the harbor is now 1.7 meters (red), whereas it was around 1.4 meters with no current. Wave height of around 0.5 meters reach the shore near the river mouth.
Thus, we see that a smaller current causes larger wave heights to propagate, while a large current will only dissipate wave energy, reducing the height of waves entering the harbor. We can also conclude that the unprotected river mouth is an area where wave heights can become significant under the right conditions, and could pose a possible navigational issue in the harbor.