Conclusion
Theoretical
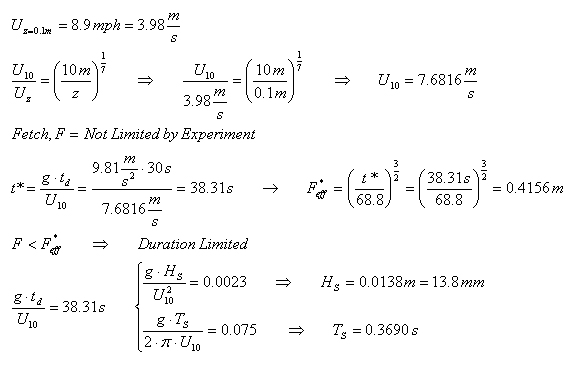
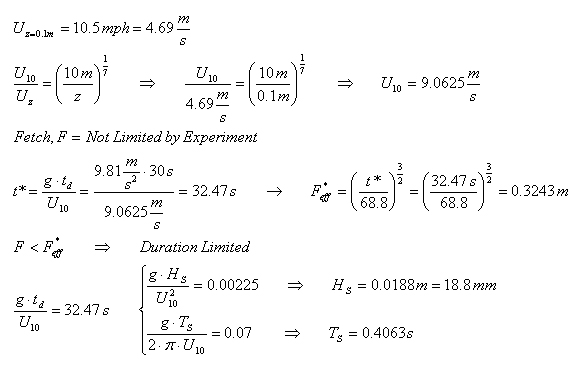
Significant Wave Height and Period (using the SMB method):
Low Wind Speed
High Wind Speed
Summary of Experimental Results:
Low Wind Speed
|
Location of
Wave Gage (cm)
|
Significant
Wave Height (mm)
|
Average
Wave Period (sec)
|
|
10
|
3.8
|
0.0885
|
|
25
|
4.2
|
0.1103
|
|
40
|
6.3
|
0.0872
|
|
50
|
6.1
|
0.1322
|
|
75
|
4.3
|
0.1064
|
|
100
|
2.7
|
0.073
|
High Wind Speed
|
Location of
Wave Gage (cm)
|
Significant
Wave Height (mm)
|
Average
Wave Period (sec)
|
|
10
|
8.5
|
0.1049
|
|
25
|
5.1
|
0.0984
|
|
40
|
9.9
|
0.092
|
|
50
|
7.5
|
0.1024
|
|
75
|
5.9
|
0.0904
|
|
100
|
4.5
|
0.1071
|

Analysis of Experiment:
Wave
Height:
The theoretical models
suggest that
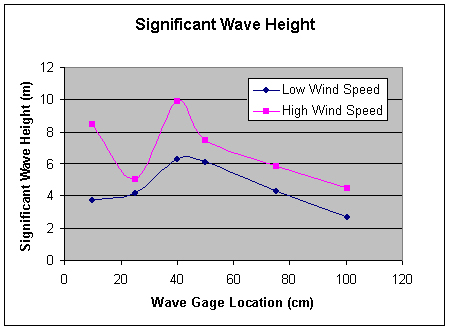
wave height should grow until it reaches the fully developed state. From the plots of the Significant Wave
Height, it can be seen that the wave height do in fact experience
growth. The first significant wave height
(at the 10
cm wave gage) appears to be an outlier because it does not agree with
the rest
of the data points. The theoretical
calculations suggest that the effective fetch is 41.56 cm for the low
wind
speed and 32.43 cm for the high wind speed. The
plots show that the experimental
results are consistent with the
theoretical calculations, in that the peaks of the significant wave
heights
occur right around 40 cm with the peak for the low wind speed occurring
at a
slightly farther distance from the fan (occurring at about 41 cm) then
that of
the high wind speed (occurring at about 39 cm). Beyond
the effective fetch, the waves
have reached their maximum wave
height (duration limited), and the wave heights diminish due to the
frictional
forces between water molecules. The
theoretical calculations suggest that the significant wave height for
the low
wind speed should be 13.8 mm and for the high wind speed it should be
18.8 mm. Theoretically, these values
should match up
with the peak significant wave heights from the plots, approximately
6.3 mm for
the low wind speed and 10 mm for the high wind speed.
From this we can see that the
experimentally
determined values do not match the theoretical values.
However, the trends that the theoretical
calculations suggest do match the experimental date, in that wave
height is directly
proportional to wind speed.
Wave
Period:
The theoretical models
suggest that
wave period should increase as waves grow into fully developed waves. Unfortunately the wave period plots of
experimental data came out scattered and do not show any definite
trends. If the second data point (the 25
cm wave
gage) for the low wind speed plot is considered to be an outlier, the
data
would in fact follow the trends that are suggested by the theoretical
models. In other words, the plot would
show that the wave period increases over the effective fetch (about 50
cm),
where it would then reach its maximum (0.13 seconds) and diminish after
that. The theoretical calculations
suggest that the wave periods should be 0.3690 sec for the low wind
speed and
0.4063 sec for the high wind speeds. These
values are obviously much higher
then the maximum wave periods
that were observed from the experimental data plots, about 0.13 sec for
the low
wind speed, and about 1.08 sec for the high wind speed.
The reason for this difference can
possibly be
attributed to the noise in the wave gages.
Sources of Error:
As
with any experiment, there are sources of error that tend to skew the
data and
throw off the results. The sources of
error that I have determined for my experiment are as follows:
1.
Repeatability of Experiment:
Since
I was limited to using only two wave gages, I had to perform the
experiment
multiple times in order to collect data at different distances from the
fan. It is difficult to precisely repeat
experiments; therefore some of the error could be attributed to
variability of
the repeated experiments.
2. Wave Gage Calibration:
The
wave gages must be properly calibrated prior to their use.
An error in the calibration process
could
skew all the data.
3. Resolution of the Wave Gages:
The
manufacturer of the wave gages claims that they have a sensitivity of
0.1
mm. Since the wave gages are fairly old,
their sensitivity could have diminished which would result in less
accurate
data.
4. Water Temperature:
Since
the water in the flume had been sitting idle for a long time before I
conducted
my experiment, the temperature of the water may not have been uniform
which
would mean the density is not uniform. A
lack of uniform water density could cause the wave generation to be
uneven.
Validity of Theoretical
Models:
The
experiment I have conducted has shown that waves do in fact grow into
fully
developed waves. Although it has not yet
been determined how exactly the phenomenon of wave growth occurs, there
are
many theoretical models that attempt to explain the growth. From my research, and the results of my
experiment, I have found the Miles (1957) theory to be the most logical
and
intuitive explanation of wave growth. Since
it is only a theory, it has yet to
be proven and further research
is required to determine exactly how water waves are generated from the
wind.
|