CEE 514
Coastal Engineering
Fall Semester 2008
Coastal Engineering
Fall Semester 2008
Modeling
Flow in Little Sand Bay Harbor
Stacey Schmidt
Results
Single Mass Flow Inlet
Multiple Mass Flow Inlets
The static pressure is very low (negative) inside the harbor, and much higher to the right of the harbor.
Single Mass Flow Inlet
Multiple Mass Flow Inlets
It appears that particle path lines cluster inside harbor, and to the right of the harbor.
First I defined a 10 kg/s
mass
flow in the direction of 63 degrees to the harbor face to observe a
rough estimate of flow characteristics of the harbor area.
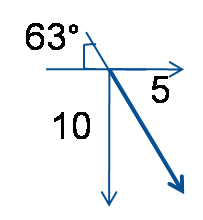
Then to better model the actual wind I kept the 63 degree 10 kg/s mass flow from the top edge but also added 1 kg/s mass flow rates orthogonal to the remaining edges.
Fluent produced velocity vectors, strain rate contours, and particle traces. The actual magnitudes are not important, but I will consider relative magnitudes.
Velocity
Vectors
Velocity vectors define the
speed and direction of the flow.
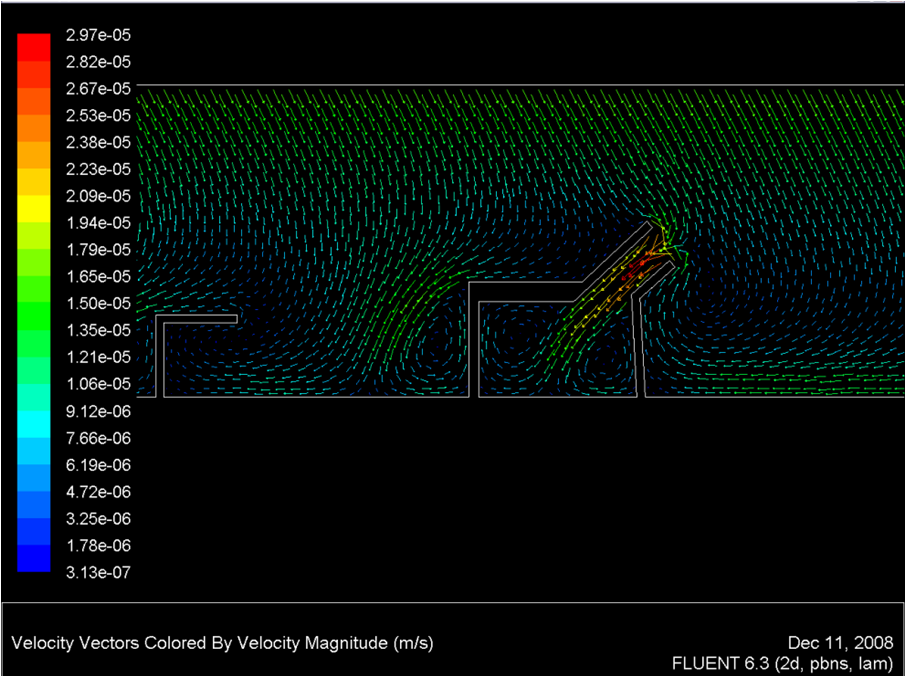
Single Mass Flow Inlet
Multiple Mass Flow Inlets
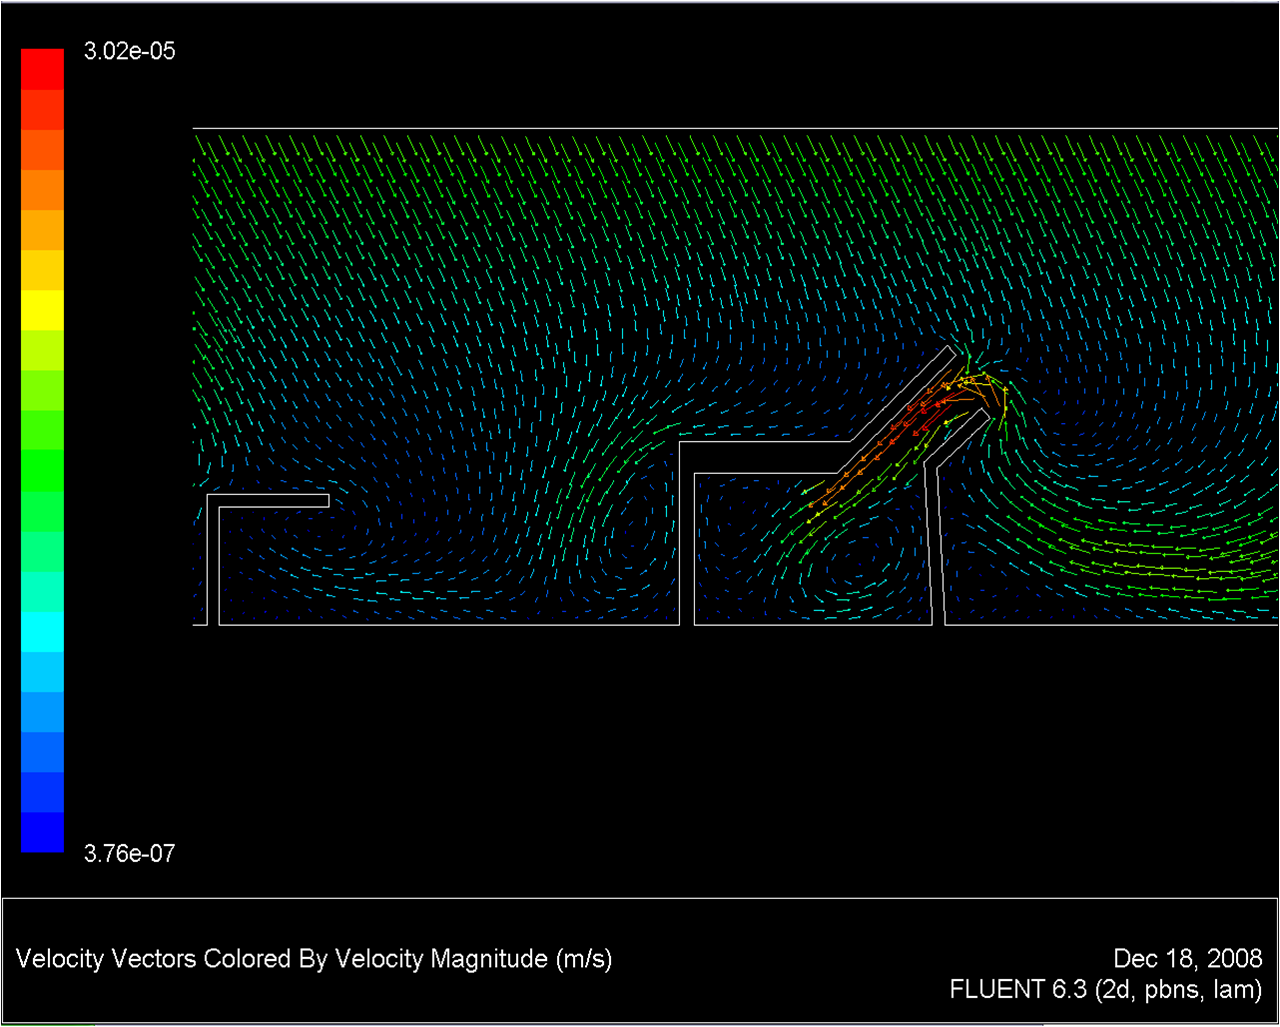
Each arrow head points in the direction of the velocity. The relative magnitude of the velocity is defined by color, with red having the highest magnitude and blue having the lowest magnitude.
The velocity was significantly larger within harbor inlet.
Single Mass Flow Inlet
Multiple Mass Flow Inlets
Each arrow head points in the direction of the velocity. The relative magnitude of the velocity is defined by color, with red having the highest magnitude and blue having the lowest magnitude.
The velocity was significantly larger within harbor inlet.
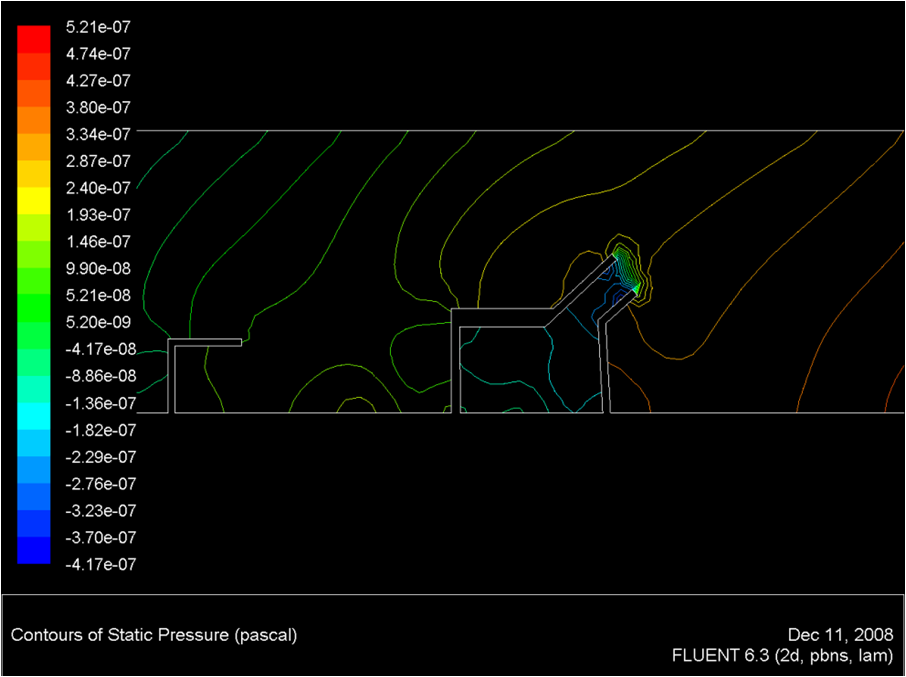
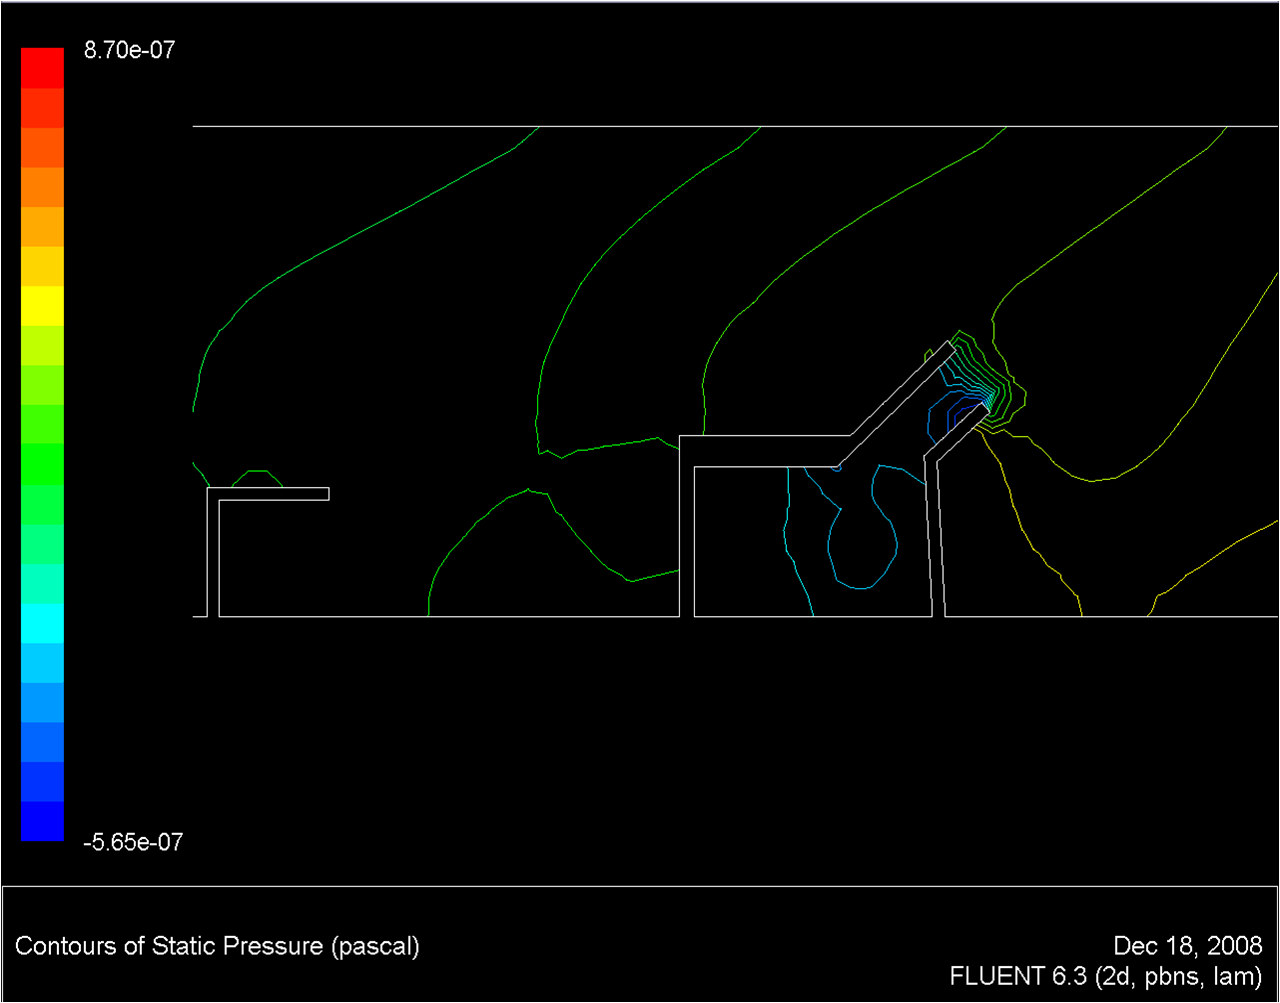
Static
Pressure
Static pressure is the force exerted per unit area, which is
easier for me to think of in pounds per square inch rather than
pascal. Single Mass Flow Inlet
Multiple Mass Flow Inlets
The static pressure is very low (negative) inside the harbor, and much higher to the right of the harbor.
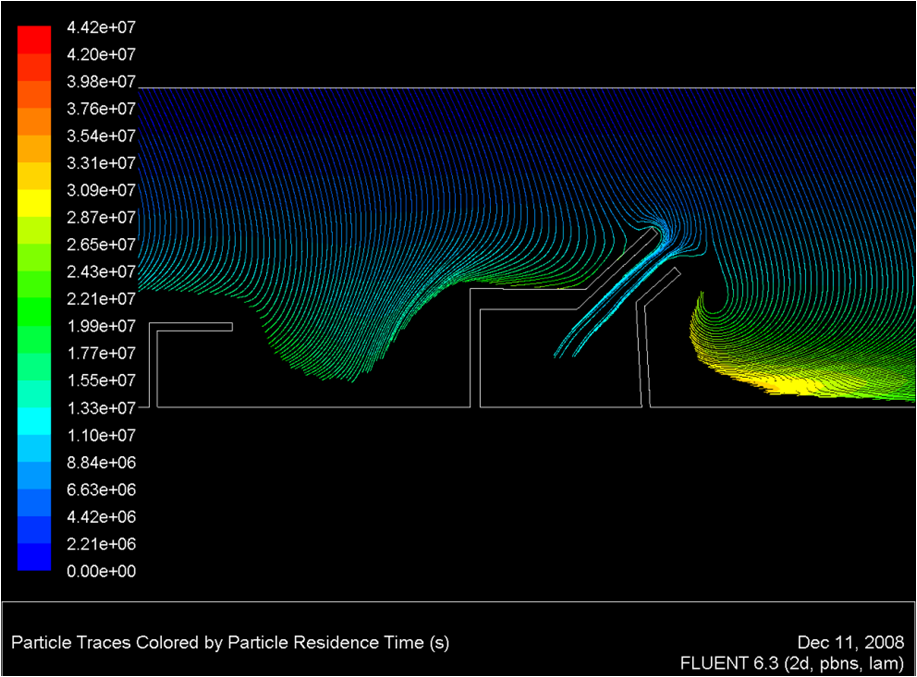
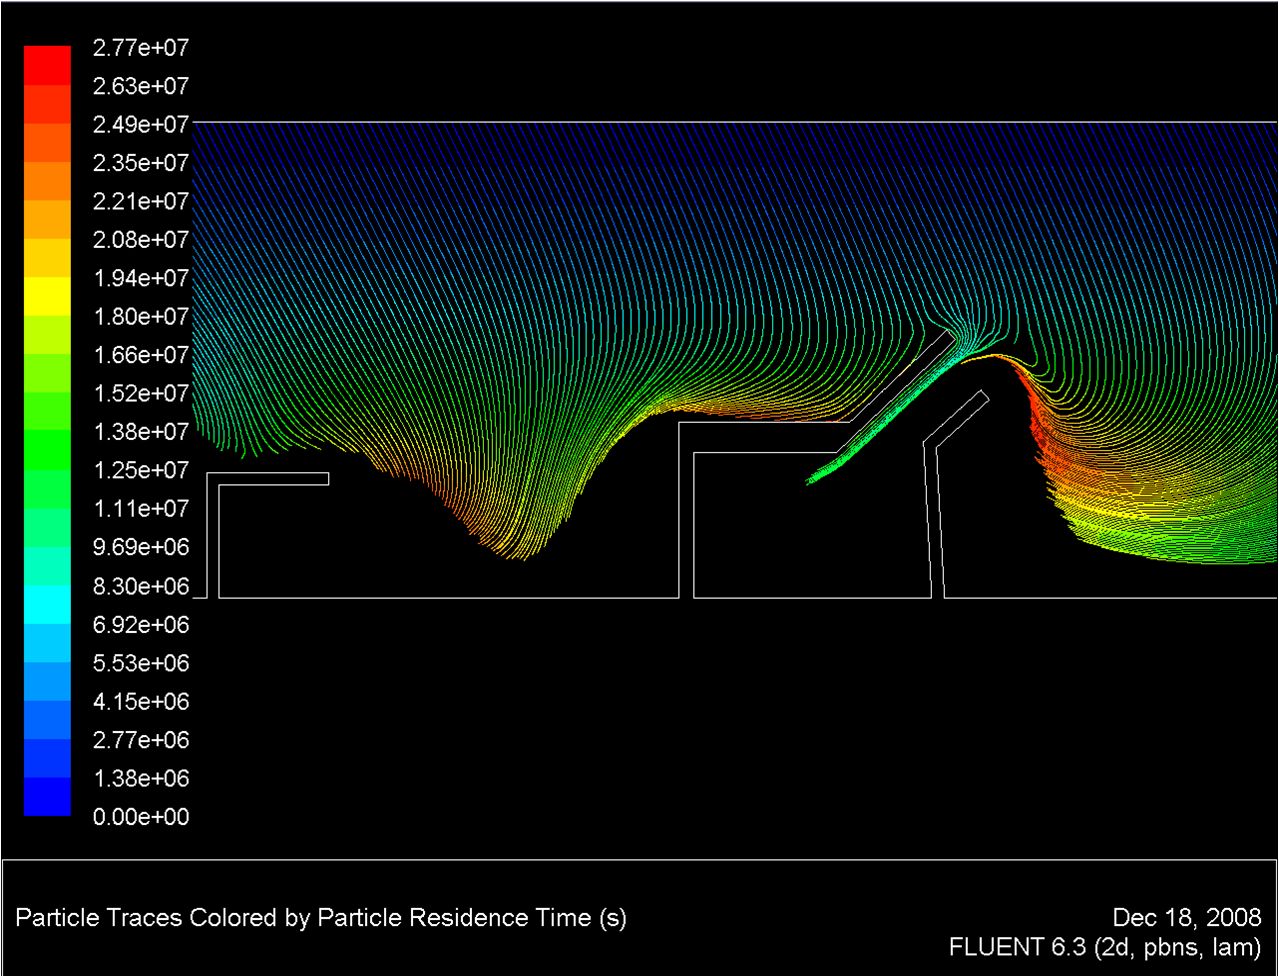
Particle
Traces
I defined a particle injection along the top edge to
get some idea of where particles would travel for these particular
scenarios. The paths are colored by time, with dark blue being
the
starting time.Single Mass Flow Inlet
Multiple Mass Flow Inlets
It appears that particle path lines cluster inside harbor, and to the right of the harbor.