|
Bathymetry Techniques |
|
History
With developments over the last 50 years, techniques for mapping bathymetry have changed to take advantage of acoustic and visual technology, as well as the improved processing rate of computers. However, no matter the technologic advancements, understanding of fluvial and glacial landforms is useful to create accurate bathymetric mapping (Hartnett).
Before 1960, depths were recorded with a weighted depth string according to a grid, that was often established only when the lake was frozen. With the development of aerial photography and sonar technology, bathymetry mapping of larger lakes could be done without the “defined grid” or weighted depth string. Instead, the bathymetry could be based on transect data from a depth sounder mapped on the aerial photographs. However, both techniques demonstrated a lack of precision, as early maps could have error ranging from 2 meters to 30 meters, depending on the area and depth of the lake. These early efforts relied significantly on map-based measurement skills and interpretation.
Since 1990, the use of Geographic Information Systems (GIS) and Global Positioning Systems (GPS) have dramatically improved the accuracy and precision of the bathymetry mapping techniques. The incorporation of computer processors/data loggers have further increased the rate with which data can be collected, thus providing greater detail to contour mapping. With GIS/GPS, surveying has become more free-form, as depths are associated with XYZ coordinates that can be mapped without additional information.
|
|
Popular Surveying Technology
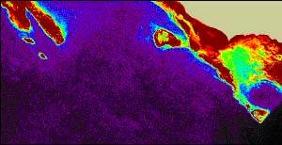
Satellite Imagery/Aerial Photography
Acquiring an image over a vast area, a great deal of information can be delineated from a satellite or aerial image in a short amount of time. Thus, satellite imagery and aerial photography are important tools when trying to classify the habitats of shallow waters. Additional data may be analyzed from the use of multispectral imaging (using multiple wavelengths of the electromagnetic spectrum, i.e. infrared, visible light, etc).
However, satellite imagery and aerial photography are best used in conjunction with other bathymetry techniques to create a complete bathymetric mapping. Typically, satellite and aerial images are of low-resolution, and cannot be used by themselves to determine bathymetry. Furthermore, environmental conditions, such as cloud cover, haze, waves, and water turbidity, can reduce the quality of the images.
Acoustic Bathymetry Survey
Acoustic Bathymetry Survey uses sonar (sound navigation and ranging) systems to collect depth information, using simple physics. Basically, a transducer emits a sound wave directly to the water’s floor, and records the time for the sound wave to be reflected back after it strikes the bottom. Because sound travels at approximately 1500 m/s in water, calculating the depth is direct. Over the last 50 years, acoustic technology has been used as the primary tool to amp underwater surface channels, lakes, and oceans.
The advantage depth sounders is that they are commonly available at a relatively low cost. Acoustics can adapted to scan beneath the water bottom’s surface (sub-bottom profiling), scan across a seabed to identify bathymetric qualities, and combined with others to provide higher resolutions.
However, acoustic surveys are typically time-consuming, as they typically have a relatively narrow scope. Most acoustic surveys cover approximately 10% of the water depths in an area, leaving many gaps. Multi-beam depth sounders, which scan wider area, are more costly and usually require additional monitoring tools. Scanning across a seabed offers a relatively wide coverage area, but lacks detail, and requires sampling to support findings.
Light and Imaging
Recently, developments in light and imaging technology have been made to help make more quantitative assessments of bathymetry. In the past, cameras were utilized to get a qualitative measure of the conditions in benthic habitats. These cameras could be handheld by divers, pulled behind boats and ships, or attached to a remote operate vehicle (ROV). However, capturing a complete image of the benthic habitat by these methods is often time-consuming, as cameras have a limited spatial coverage, defined by the lenses used. For this reason, wider scanning techniques, such as acoustical surveys or satellite mapping, are employed first.
In contrast, Laser Line Scanning (LLS) is bridging the gap between side-scan sonar and still photography/video, with a modest scope and high resolution, typically 0.1-1 cm. However, the technology is still new and in the trial phase, and is not yet widely available.
All light and imaging techniques are dependent on the water clarity and focal distance. Thus, all light and imaging techniques are susceptible to error with murky water.
For additional information on these and other technologies, please visit http://www.csc.noaa.gov/benthic/mapping/techniques/techniques.htm
|
|
Satellite Mapping Image Source: NPA Satellite Mapping |
|
Three-Dimensional Bathymetry Relief produced from acoustic survey conducted at Perhentian Besar in Malyasia (5◦ 53’ N, 102◦ 45’ E). Source: Trond-Inge Kvernevik |
|
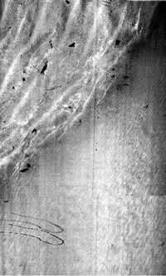
Laser Image, indicating sharp difference between sand waves and smooth seafloor. Source: NOAA
|
|
Contact Me at jwilke1@wisc.edu |