RESULTS
FVCOM produces a NetCDF output file that is used to extract data. This file was used in two ways that can be seen below. First, the data was processed with visualization software called VISIT. Second, the data was analyzed at three particular points of interest. The three points are representative as the three transport areas between Monona Bay and Lake Monona. MatLAB was used to process the data at these points and make a video that shows the cross sectional velocity and how it changes with time.
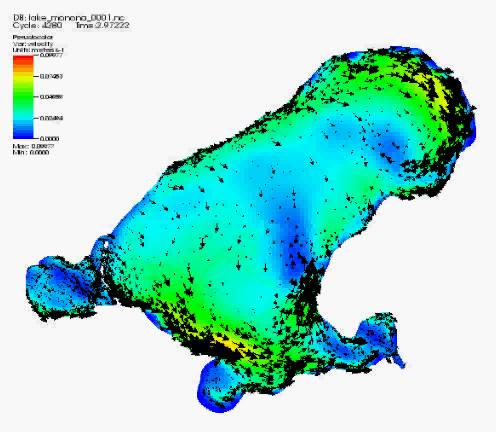
Click the image below for a video of the velocity vectors for the entire Lake Monona.
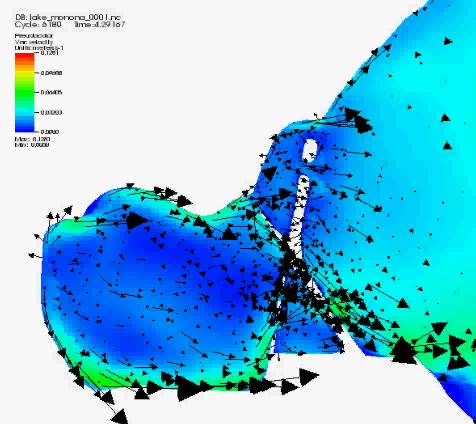
Click the image below for a video of the velocity vectors for Monona Bay.
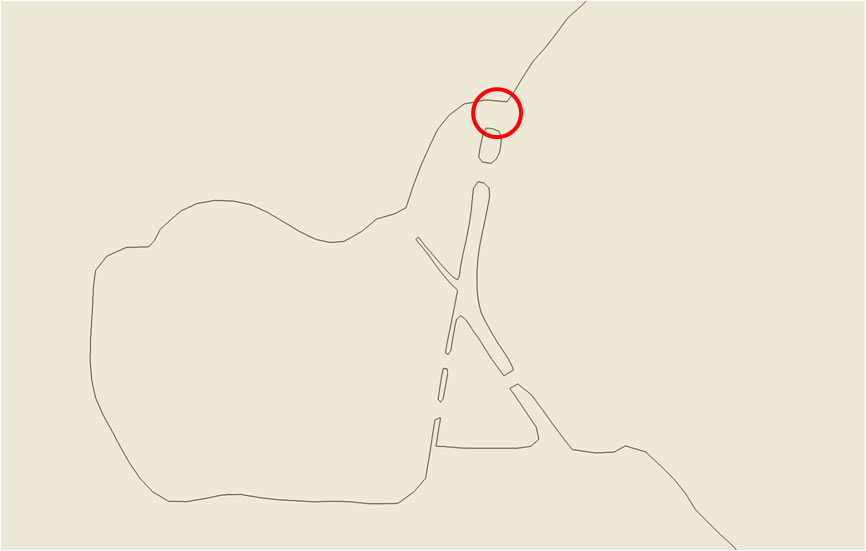
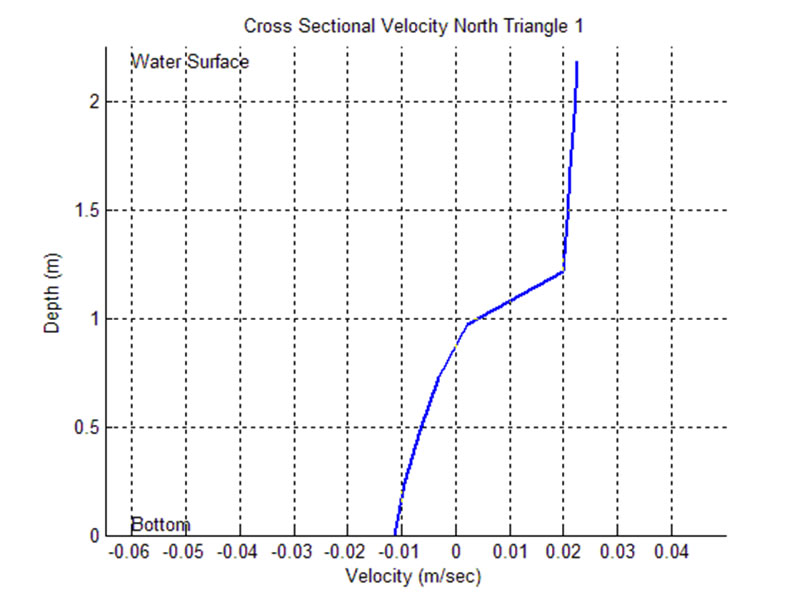
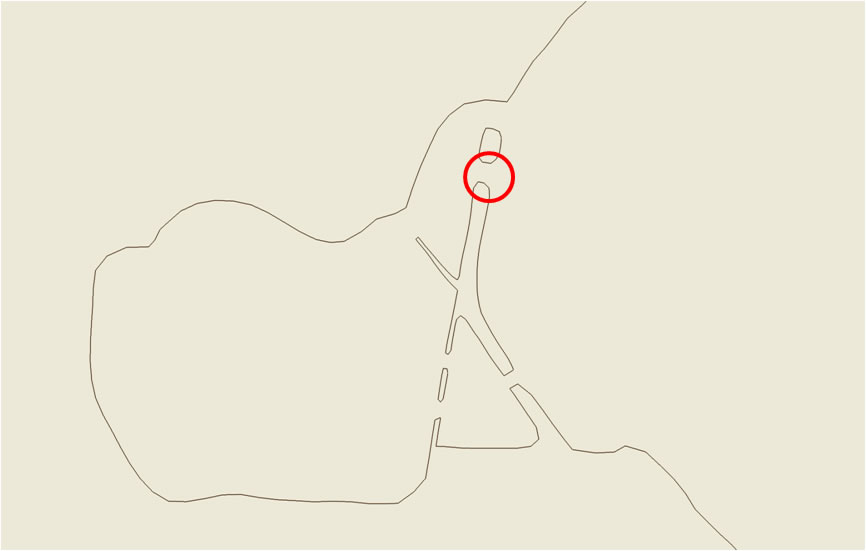
The North Triangle has two transfer areas for water to travel between Monona Bay and Lake Monona. The first transfer point is identified below. Click on the image of the graph to show a video for the velocity and movement of water and how it changes with respect to time.
 __________
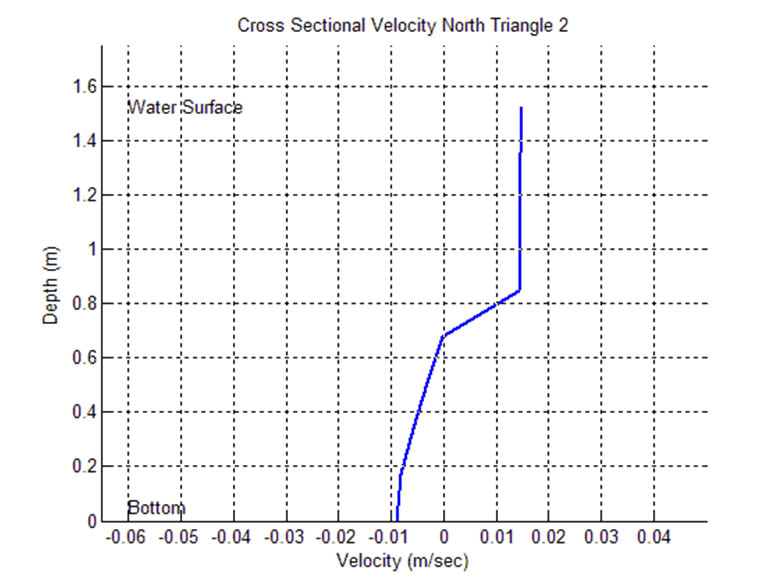
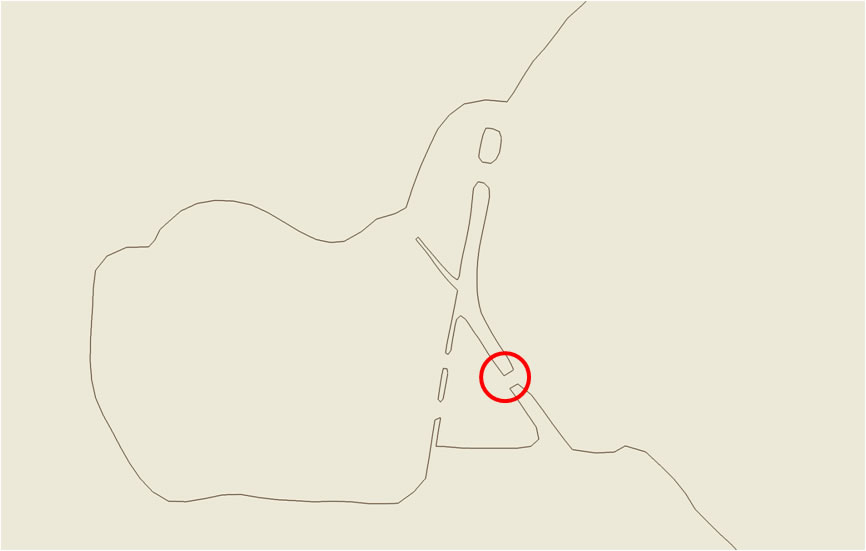
The second transfer area for the North Triangle is identified below. Click on the image of the graph to show a video for the velocity and movement of water and how it changes with respect to time.
 __________
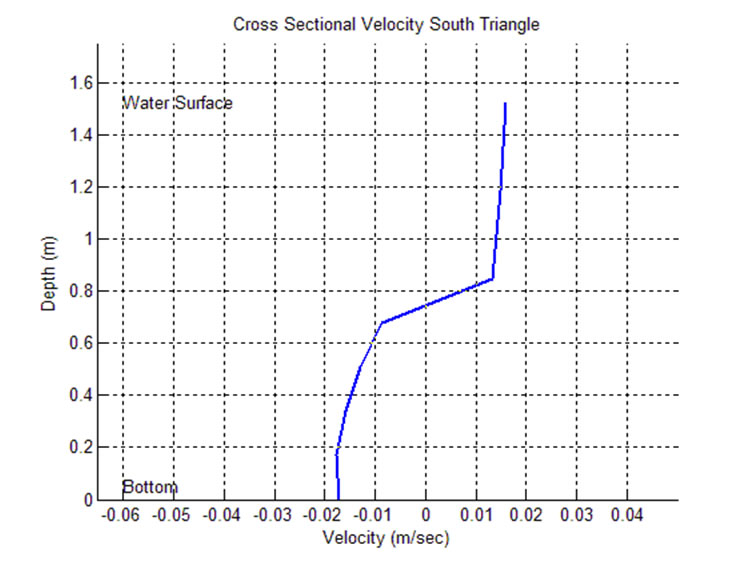
The third transfer area is located within the South Triangle. Click on the image of the graph to show a video for the velocity and movement of water and how it changes with respect to time.
 __________