|
|
|
|
|
|
|
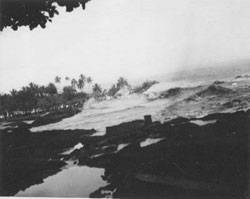
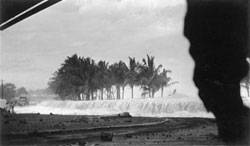
Figure 1: 1946 Tsunami and Damage in Hawaii (Tsunami 2006) |
Tsunami Characteristics and Threat to the
Western US Coast
CEE 514 – Coastal Engineering Final Project
By Justin Rogers
University of Wisconsin-Madison
Table
of Contents
Introduction
This project was developed primarily out of an interest in understanding more about tsunami physics, the history of tsunamis on the west coast of the US, and ultimately identifying potential tsunami risks in the future. A tsunami is a series of waves with a very long wavelength and period, which are generated by a large impulsive displacement of water, usually by an earthquake (NOAA 2006). The name tsunami comes from a Japanese word meaning harbor wave. Tsunamis are also sometimes called tidal waves, although tsunamis have nothing to do with periodic tides. Tsunamis are common in the Pacific Ocean and most cause no damage due to their low runup. However, large tsunamis can cause massive damage and loss of life as was evident from the 2004 Indian Ocean Tsunami. Therefore an understanding of the mechanism and probability of tsunami generation and propagation is key to quantifying tsunami risk to the western US coast.
Tsunami
Physics
A tsunami is a series of waves with extremely long wavelength which are generated by an impulsive disturbance that displaces a large volume of water (NOAA 2006). An understanding of the physics of tsunamis is comprised of wave initiation, wave propagation, and landfall characteristics.
Wave
Initiation
A tsunami can be generated by any disturbance that displaces a large amount of water. Therefore, tsunamis are generated by earthquakes, subarial landslides (above water) to water, submarine landslides (below water), meteors and volcanoes (both subarial and submarine). By far, the most common mechanism for tsunami generation is by earthquake. Tsunamis generated by landslides are generally local in their effect, while those generated by earthquake uplift can have ocean-wide impacts (NOAA 2006).
|
|
Figure 3: Tsunami Generation by Earthquake (Roach 2005) |
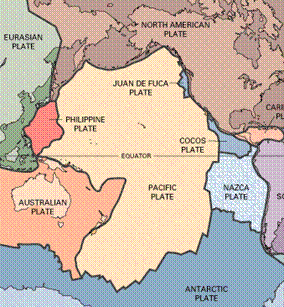
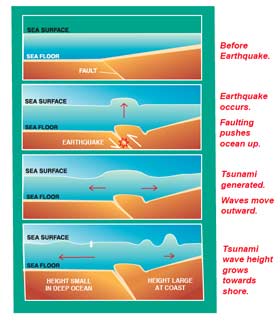
Earthquakes generate tsunamis when the sea floor abruptly deforms and displaces the overlying water from equilibrium (Figure 3). A wave then propagates as the force of gravity attempts to restore the water to equilibrium. The determining factor in the size of generated tsunami is the amount of vertical sea floor deformation. This deformation is difficult to determine, but is a function of the earthquake’s magnitude, depth, fault characteristics, and coincident slumping of sediments (NOAA 2006). Earthquakes are random events, and their occurrence determined by probability. Therefore, areas of high probability for earthquakes near the coast or underwater are areas of high probability for tsunami generation. Figure 2 shows the tectonic plates of the pacific basin, which are associated with a high earthquake probability. Areas of high earthquake probability that have the greatest potential to generate tsunamis on the western US are located near: Japan, Chile (Nazca Plate), Alaskan Aleutian Islands, South Central Alaska, the Pacific Northwest (Juan de Fuca Plate and Cascadia Fault), and California (San Andreas Falut).
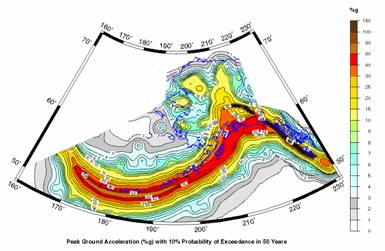
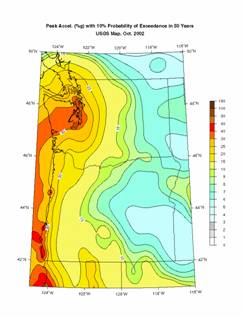
Figures 4-6 show seismic hazard maps for Alaska, the Pacific Northwest, and California and show the peak ground acceleration for a 10% exceedance probability in 50 years.
|
Figure 4: Alaska Earthquake Hazard Map (Wesson et al 1999) |
Figure 5: Pacific Northwest Earthquake Hazard Map (USGS 2006b) |
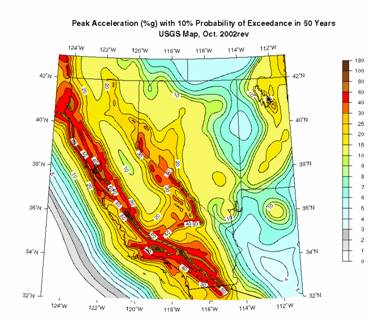
Figure 6: California Earthquake Hazard Map (USGS 2006b) |
Deep
Ocean Wave Propagation
|
Figure 7: Tsunami Wave Speed as a Function of Depth |

A tsunami in the deep ocean is characterized by a very long wavelength (typically over 500 km), long period (10 min to 2 hr), and a low height (typically under 1 m) (NOAA 2006). A tsunami is a shallow wave as the ratio of length/depth is very high. Based on this, the wave propagation speed (c) is only a function of the water depth (d) and the gravitational constant (g) and is defined by: c = (gd)^(1/2). This relationship is shown in Figure 7 for depth of 10 m to 6000 m. Clearly, travel time of a tsunami is function of the bathymetry of the path. Numerical models have been developed to determine travel times of tsunamis originating from probable earthquake regions. Some of these results are shown in the historical data section below.
The rate at which a wave loses energy is inversely proportional to its wavelength, and therefore a tsunami loses very little energy in deep water (NOAA 2006). Based on this, a tsunami can traverse the entire Pacific Ocean in less than a day. Tsunamis in the deep ocean are not noticeable by air, or by ships.
Nearshore and Shoreline Landfall
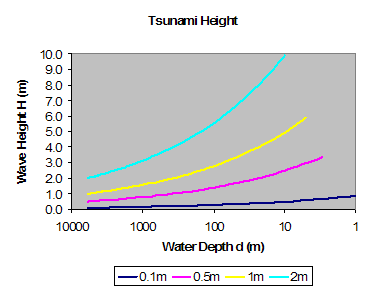
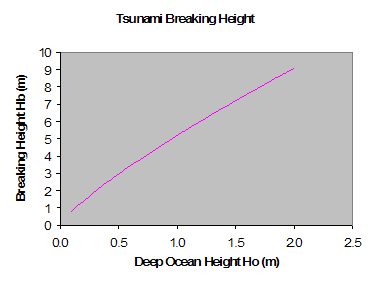
The transition to the nearshore and shoreline areas causes several changes in the tsunami. Among these are an increase in height, and a decrease in wave speed. The wave speed changes as shown in Figure 7. Figure 8 shows the increase in wave height as a function of decreasing depth. This is based on the assumption that the wave conserves energy, and the height at a point of interest (H) is thus: H = Ho(Co/C)1/2. Figure 9 shows the probable breaking wave height as a function of the deep ocean height Ho based on the criteria that (H/d)max = 0.65, which is a simplified assumption. The breaking wave in a tsunami is typically a surging condition, as the surf similarity parameter is typically much greater than 3.3.
|
Figure 8: Tsunami Height as a Function of Depth and Initial Height |
Figure 9:Tsunami Breaking Height as a Function of Deep Ocean Height |
When a tsunami reaches the shore it rarely takes the form of a great towering wave, but typically may take several forms such as a rapidly rising or falling tide, a series of breaking waves, or even a bore (NOAA 2006). A bore is a step-like wave with a step breaking front, which occurs when a tsunami moves into a shallow bay or river. The water level onshore may be very high depending on many factors such as reefs, bays, estuaries, undersea features and beach slope. Within a region, one area may experience significant damage from a large wave, and another coastal area may see no destructive wave damage. A tsunami is often a series of waves (see historical data), and the first may not be the most damaging. Flooding from the wave can extend inland large distances, and is dependant on the initial wave, and other coastal properties. The retreat of the wave can also be damaging as it may carry debris and people out to sea.
Historical
Data
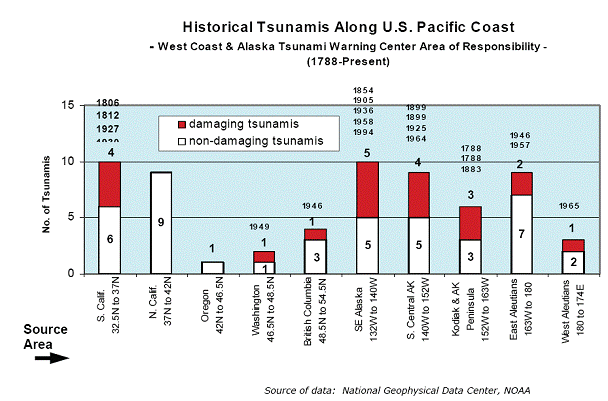
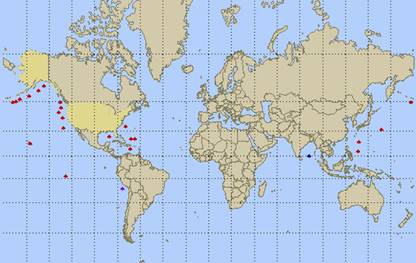
There have been 53 recorded tsunamis that have struck the western US since 1700, and 12 of those resulting in fatalities. Figure 10 shows historic tsunamis along the US Pacific Coast for 1788 to the present.
|
Figure 10: Historic Tsunamis Along the US Pacific Coast (NOAA 2006) |
Additionally, Table 1 shows all significant tsunamis with fatalities on the western US coast since 1700. A full list of all observed tsunamis since 1700 is available here.
|
Tsunami Date (yyyy mm dd) |
Source Location |
Maximum runup (m) |
Fatalities |
|
1700 01 26 |
Cascadia Fault, Washington |
Unk- Major |
Unk - Major |
|
Alaska Peninsula |
30 |
100 |
|
|
Lituya Bay, Alaska |
120 |
100 |
|
|
Cook Inlet, Alaska |
6 |
7 |
|
|
Southern California |
3 |
1 |
|
|
Lituya Bay, Alaska |
24 |
5 |
|
|
Eastern Aleutian Is., Alaska |
35 |
6 |
|
|
Southern California |
3 |
1 |
|
|
Southeastern Alaska |
525 |
5 |
|
|
South Central Chile |
2.4 |
2 |
|
|
Gulf of Alaska |
67.1 |
122 |
|
|
Southeastern Alaska |
7.6 |
1 |
Table 1: Major Tsunamis Along the Western US Coast 1700 to present (NOAA 2006)
As shown by Figure 10 and Table 1, Alaska is one of the major cause of historical tsunamis along the US coast. The three most damaging tsunamis since 1700 are: 1964 Gulf of Alaska, 1700 Cascadia Fault, and Lityua Bay (1700, 1788, 1854, 1900, and 1958). These three areas will be discussed in more detail below.
1700 Cascadia Tsunami
|
Figure 11: Cascadia Fault (USGS 2005) |
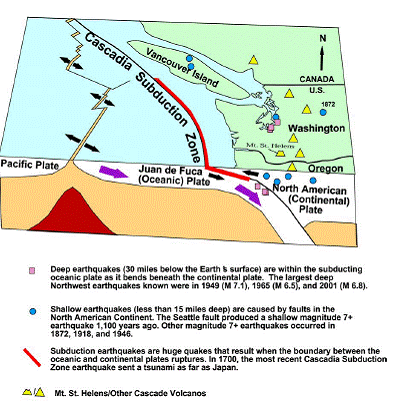
No direct records of the Cascadia Tsunami of 1700 exist, and rational for this event is largely based on a combination of scientific evidence. It is well known that the Cascadia Subduction Zone is formed by the meeting of the Juan de Fuca and Pacific plates (Figure 11). It is also well known that this zone is capable of producing large earthquakes and tsunamis. There is historic evidence that this zone has a major earthquake every 300 to 900 years, and previous major events having occurred in 1310, 810 and 710 BC, and the most recent in 1700 (Wikipedia 2006).
The dating for the 1700 Cascadia tsunami is largely based on a combination of records from land level changes, tree ring data, tsunami sediment traces, historic records from Japan, tubidite records, and native tales (Flynn et al). Records from Japan indicate a tsunami reached 1–5 m heights at seven shoreline sites in Japan on January 27th, 1700, which would have been caused by a magnitude 8.7 to 9.2 earthquake (Satake 2003).
The actual size of the tsunami striking the Pacific Northwest is unknown, but damage would have been significant. As there are no written records, we can only deduce that hundreds and possibly thousands of people were killed in the earthquake and sequent tsunami. The Cascadia fault has not had a significant event since 1700, and as time goes on, the probability of another major earthquake increases. It is well accepted that a major earthquake along the Cascadia fault would cause significant damage to Seattle as well as many other coastal cities along the west coast. Several model simulations have been performed of this hypothetical event (NOAA 2006):
- Bellingham Inundation [4.5 MB file, .mp4]
- Anacortes and Whidbey Island Inundation [8.3 MB file, .mov]
- Seattle Inundation [18.6 MB, Quicktime]
|
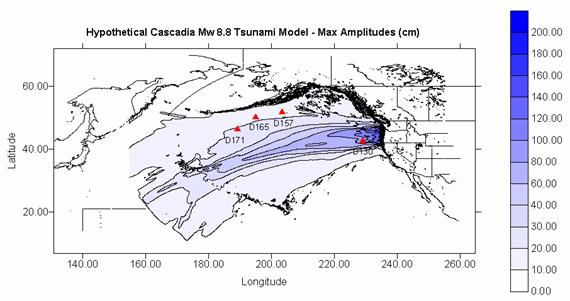
Figure 12: Cascadia Modeled Tsunami Max Amplitudes (NOAA 2006). |
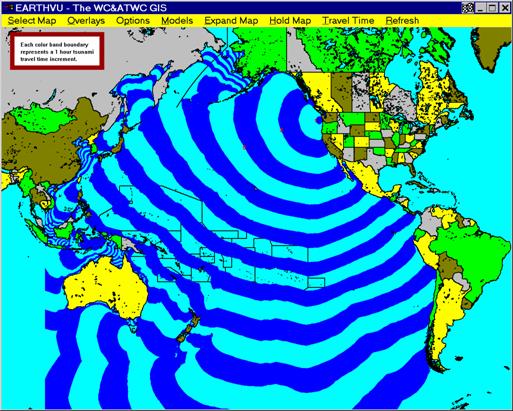
Figure 13: Cascadia Tsunami Travel Times (NOAA 2006). |
1964
Alaskan Basin Tsunami
|
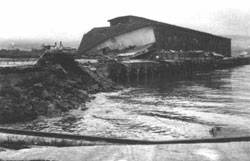
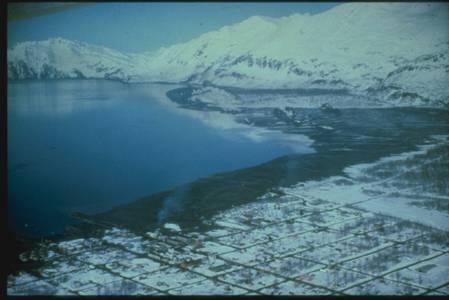
Figure 14: 1964 Alaskan Tsunami Damage in Valdez, AK (NOAA 2006) |
The Great Alaskan Earthquake of 1964 was the largest recorded earthquake in North America and the second largest ever recorded (largest occurred in Chile in 1960) (Sokolowski). The earthquake occurred at 5:36pm on March 27, 1964, Alaska Standard Time. The epicenter was in the Northern Prince William Sound (61.1N 147.5W) about 75 miles E of Anchorage, or about 55 miles west of Valdez and the reported Richter magnitudes (Ms) for this earthquake ranged from 8.4 to 8.6, and the moment magnitude (Mw) is reported as 9.2 (Sokolowski). The following excerpt is taken from Sokolowski:
Although Alaska's
seismic and tsunamigenic history is only about 200
years or so, it is extremely seismic with the Pacific plate subducting
under the North American plate. This subduction zone
is referred to as the Aleutian-Alaska megathrust zone
and makes the coastal areas very dangerous with regard to tsunami generation - tsunamigenesis. The vertical crustal
movements in this area result in vertical sea floor displacements, thus highly tsunamigenic. Three past tsunamis that were generated in
Alaska have resulted in Pacific wide death and destruction. Tsunamigenic
events occurring about the Alaskan Peninsula, Aleutians, and Gulf of Alaska
have a very high potential for generating local and Pacific wide tsunamis. In
the southeast, the major fault is the Fairweather
fault which does have a history of vertical displacements (>12 meters), but
is inland. This fault has not caused large tectonic tsunamis as the other
Alaskan areas. However, events occurring in this region have induced large subareal and submarine landslides, which in turn, have
generated massive local tsunamis. Subareal and
submarine landslides, with induced massive local tsunamis, can and have
occurred in this area without an earthquake!
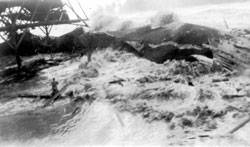
|
Figure 15: Alaskan Tsunami of 1964 at
Sitka, AK (NOAA 2006) |
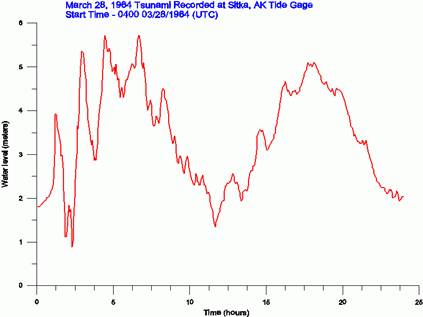
The 1964 earthquake caused
115 deaths in Alaska alone, with 106 of these due to tsunamis which were
generated by tectonic uplift of the sea floor, and by localized subareal and submarine landslides. The earthquake shaking
caused at least 5 local slide generated tsunamis within minutes after the
shaking began. (In general, slide/slump induced tsunamis are generated within a
few minutes after an earthquake starts.) These five occurred at Valdez (2),
Seward, Whittier, and Kachemak Bay. Tsunamis
generated by the 1964 earthquake (and their subsequent damage, loss of life,
etc.) were recorded throughout the Pacific (Lander and Lockridge,
1989). This was the most disastrous tsunami to hit the U.S. West Coast and
British Columbia in Canada. The largest wave height for this tsunami was reported
at Shoup Bay, Valdez Inlet (67 meters). Summary of
lives lost and damage for Alaska, Canada, Washington, Oregon and California
are: Alaska- 106 deaths and $84 million; British Columbia- $10 million;
Washington- minor damage throughout the coast; Oregon- 4 deaths and $0.7
million, with much of the damage away from the coast where rivers overflowed;
California- 13 deaths and $10 million damage.
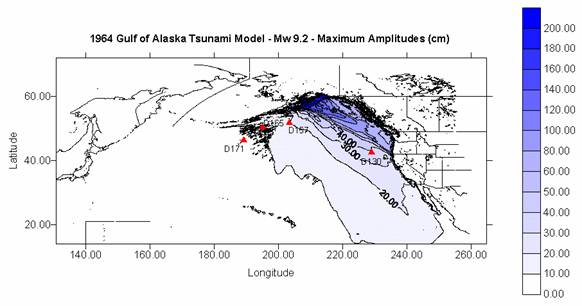
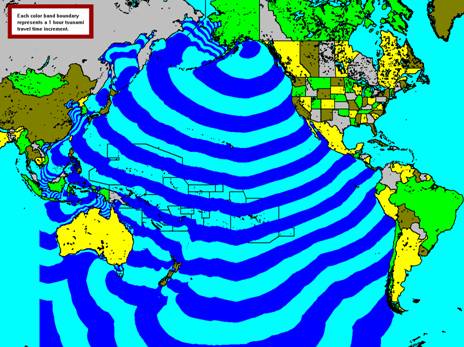
Figures 16 and 17 show modeled tsunami height and travel times. To view damage reports and measured wave heights, click here (NOAA 2006). Additional data is available through the NOAA 1964 Alaskan Tsunami website.
|
Figure 16: 1964 Gulf of Alaska Modeled Wave Heights (NOAA 2006) |
Figure 17: 1964 Gulf of Alaska Modeled Tsunami Travel Times (NOAA 2006) |
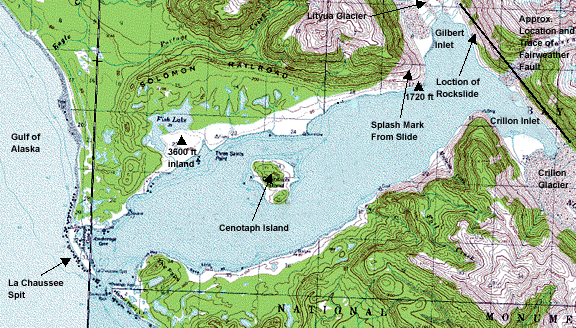
Lituya Bay, Alaska
|
Figure 18:Lituya Bay Alaska (Carayannis 1999) |
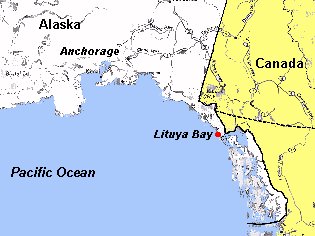
Lituya Bay has been the source 5 recorded tsunamis since 1854. The following table lists the runup and fatalities associated with these events. The tsunami of 1958 generated a runup of 525 m, the largest ever recorded.
|
Tsunami Date (yyyy mm dd) |
Max. runup (m) |
Fatalities |
Source Type |
|
120 |
100 |
Landslide |
|
|
24 |
0 |
Landslide |
|
|
24 |
5 |
Earthquake/Landslide |
|
|
150 |
0 |
Landslide |
|
|
525 |
5 |
Earthquake/Landslide |
Table 2: Lituya Bay Tsunamis 1854 to Present. Red Indicates Approximate Value (NOAA 2006).
The mechanism for the 1958 event is described in detail by Carayannis (1999). Essentially, the giant wave runup of 525 m was the result of an enormous subaerial rockfall into Gilbert Inlet at the head of Lituya Bay. This rockfall was triggered by a large earthquake, which impacted the bottom of the inlet with great force which uplifted 1300 feet of ice along the entire front of the Lituya Glacier. This, combined with a net vertical uplift of 3.5 feet from the earthquake, resulted in a giant solitary wave which swept the main body of the bay (Caraynnis 1999). The other 4 tsunamis in Lituya Bay are not well documented, but were significant and all the result of landslides and/or earthquakes. However, none of these tsunamis were significantly damaging outside of the bay itself. However, the 1958 tsunami was detected in Hawaii with a 0.1 m amplitude.
Lituya Bay remains in danger of tsunamis, especially within the bay.
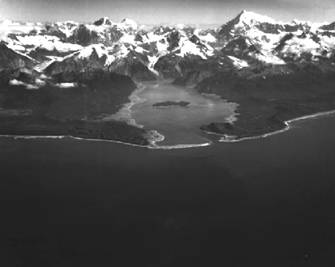
|
Figure 19: Lituya Bay and 1958 Tsunami Damage (USGS 1958) |
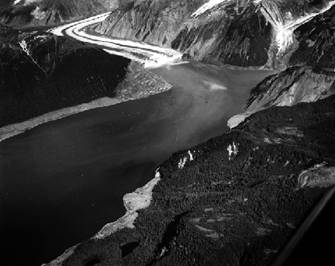
|
Figure 20: Aerial View of Lituya Bay and 1958 Damage (USGS 1958) |
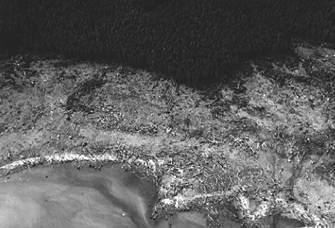
Figure 21: Aerial View of Lituya Bay and 1958 Damage (USGS 1958) |
Figure 22: Aerial View of Lituya Bay and 1958 Damage (USGS 1958) |
Potential
Risks
The question is not if a major tsunami will strike the Pacific, but when. Because earthquakes and landslides are very difficult to predict, it is impossible to determine the exact time and location of the next major tsunami. We can make assumptions as to the probability of earthquakes, and an estimate as to probable wave height and thus damage. Due to modern technology and the ability to detect tsunamis on an ocean wide scale (along the US coast), warnings from tsunamis coming towards the west coast are possible to give at least several hours of warning for evacuation and thus minimize fatalities. However, it is tsunamis generated near the coast that would only allow for minutes between the initial earthquake and the following tsunami. Below is a table indicating sources of potential tsunamis that could strike the western US, potential damage areas, and warning time between the initial earthquake and the tsunami. The estimate of tsunami damage in specific cities is beyond the scope of this project, but is an issue that should be addressed.
|
Major Tsunami Source* |
Probable US Impact |
Maximum Warning (hr) (+/- 30 min) |
|
Chile |
CA OR WA AK HI |
13.5 15 16 19 14.5 |
|
Japan |
CA OR WA AK HI |
9.5 9 9 6 7 |
|
Alaska Aleutian Islands |
Aleutian Islands Mainland AK WA OR CA HI |
Minutes 3 5.5 6 6 5 |
|
South Central Alaska |
AK WA OR CA HI |
Minutes 4.2 4.5 5.5 6 |
|
Southeastern Alaska |
AK HI |
Minutes 6 |
|
Cascadia Fault Washington |
WA/OR HI |
Minutes 6 |
|
San Andreas Fault, California |
CA HI |
Minutes 5.5 |
Table 3: Potential Tsunami Sources, Impact Areas and Maximum Warning Time (NOAA 2006) *This is not a comprehensive list, and is intended to represent the major probable causes of potential earthquakes.
Preparedness
NOAA operates the West Coast and Alaska Tsunami Warning Center, as a division of the National Weather Service. This center operates the DART (Deep Ocean Assessment and Reporting of Tsunamis) buoy system which serves as the primary warning system for the western US coast. As shown in Figure 23, there are currently 16 buoys in the Pacific, which are closely monitored for tsunamis There are other entities which maintain buoys such as the University of Hawaii.
|
Figure 23: NOAA DART Buoy Warning System (NOAA 2006) |
NOAA is currently advocating coastal communities to enroll in a Tsunami Ready program. This is a National Weather Service (NWS) program conducted in close coordination with state emergency management agencies and promotes tsunami hazard preparedness as an active collaboration among federal, state, and local emergency management agencies, the public, and the NOAA tsunami warning system (NOAA 2006). The Tsunami Ready system is based on the National Weather Service StormReady program, with the main goal is to increase public safety during tsunami emergencies.
This system is currently operating, but all experts agree that more needs to be done for tsunami preparedness along the western US coast. Issues that could be improved include installation of more DART buoys, and improvement to sensing of earthquakes and tsunamis. Additionally, the warning system to alert the public should be improved. Finally, better coastal engineering design should be employed accounting for the possibility of tsunamis.
Conclusion
A tsunami is a series of waves with a very long wavelength and period, which are generated by a large impulsive displacement of water, usually by an earthquake (NOAA 2006). Tsunamis are common in the Pacific Ocean and most cause no damage due to their low runup. However, large tsunamis can cause massive damage and loss of life, which has occurred numerous times along the US coast. Three major historic tsunamis were investigated: 1700 Cascadia Tsunami, 1964 Alaskan Basin Tsunami, and the Lituya Bay Tsunamis. The question is not if a major tsunami will strike the Pacific, but when, and therefore preparedness for a tsunami along the western US coast is important. The current warning system is operational, but needs refinement by improving: sensing technology, buoys, the emergency alert system and coastal design.
About
the Author
 Justin Rogers is a civil engineering graduate
student at the University of Wisconsin-Madison.
This coastal project is being written just prior to my graduation with
my MS in Civil and Environmental Engineering, with and emphasis in Water
Resources and Environmental Fluid Mechanics.
I am moving soon to San Diego, California where I will be working at HDR
Engineering. If you have any questions
about the project, my email is rogersjs77@yahoo.com.
Justin Rogers is a civil engineering graduate
student at the University of Wisconsin-Madison.
This coastal project is being written just prior to my graduation with
my MS in Civil and Environmental Engineering, with and emphasis in Water
Resources and Environmental Fluid Mechanics.
I am moving soon to San Diego, California where I will be working at HDR
Engineering. If you have any questions
about the project, my email is rogersjs77@yahoo.com.
Disclaimer
This project was developed as part of an educational class and was a learning experience for me. I am not an expert on coastal engineering issues, and therefore what is said in this report is based on my understanding of information encountered in research. It should NOT be considered a comprehensive or authoritative work on tsunami impacts to the western US, and preference should be given to the sources listed below.
References
· Carayannis, George. 1999. Analysis of Mechanism of The Giant Tsunami Generation in Lituya Bay on July 9, 1958. From a Paper Presented at the Tsunami Symposium on May 25-27, 1999, in Honolulu, Hawaii, USA.
· Flynn, Ray, Kyle Fletcher. The January, 1700 Cascadia Subduction Zone earthquake and tsunami. http://www.ess.washington.edu/SEIS/PNSN/HAZARDS/CASCADIA/cascadia_event.html.
· National Oceanic and Atmospheric Administration (NOAA). 2006. NOAA Tsunami Webpage. http://wcatwc.arh.noaa.gov/characteristics.htm.
· Roach, John. 2005. “Is Tsunami Threat to U.S. West Coast Bigger Than Predicted?” National Geographic News, December 21, 2005. http://news.nationalgeographic.com/news/2005/12/1221_051221_northwest_tsunami.html.
· Robert L. Wesson, Arthur D. Frankel, Charles S. Mueller, and Stephen C. Harmsen. 1999. Probabilistic Seismic Hazard Maps of Alaska. USGS Open-File Report 99-36. http://earthquake.usgs.gov/research/hazmaps/products_data/48_States/index.php.
· Satake, Kenji. 2003. Fault slip and seismic moment of the 1700 Cascadia earthquake inferred from Japanese tsunami descriptions. JOURNAL OF GEOPHYSICAL RESEARCH, VOL. 108, NO. B11.
· Sokolowski, Thomas J. THE GREAT ALASKAN EARTHQUAKE & TSUNAMIS of 1964. West Coast & Alaska Tsunami Warning Center, Palmer Alaska.
· Tsunami. 2006. Archive Photos: 1946 Tsunami. http://www.tsunami.org/archivespics.htm.
· US Geological Survey (USGS). 2006a. Major Tectonic Plates of the World. http://geology.er.usgs.gov/eastern/plates.html.
· USGS 1958. 1958 Lituya Bay Tsunami, USGS. 2006. http://www.usc.edu/dept/tsunamis/alaska/1958/webpages/.
·
USGS. 2005. Earthquake Hazards in Washington and
Oregon - Three Source Zones
· USGS. 2006b. Probabilistic Seismic Hazard Maps of the US. http://earthquake.usgs.gov/research/hazmaps/products_data/48_States/index.php.
· Wikipedia. 2006. Cascadia Fault Tsunami. http://en.wikipedia.org/wiki/Cascadia_Earthquake.