by Dave Huwe, CEE 514
Coastal Engineering Student, Fall, 2006
Table of Contents
We have studied the calculations used to find the recurrence intervals of wind and wave events.It seems natural to ask Do these calculations apply during a time of climate change?So I studied a historical record to determine if we can expect the recurrence intervals of wind and wave events will continue to be relevant as temperatures rise.
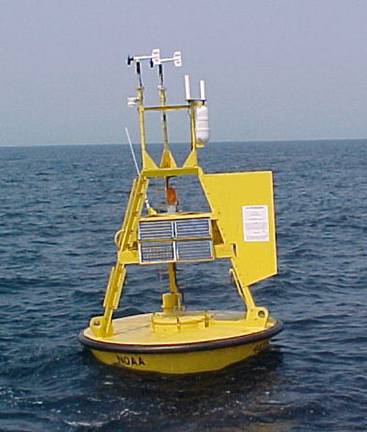
The source of the wind data I used is National Data Buoy Center Moored Buoy 45007.The information about this buoy, including the photo and graphic I have used, and the data it has collected are available at:http://www.ndbc.noaa.gov/station_page.php?station=45007.
 |
 |
|
Photo
of NDBC Moored Buoy 45007
|
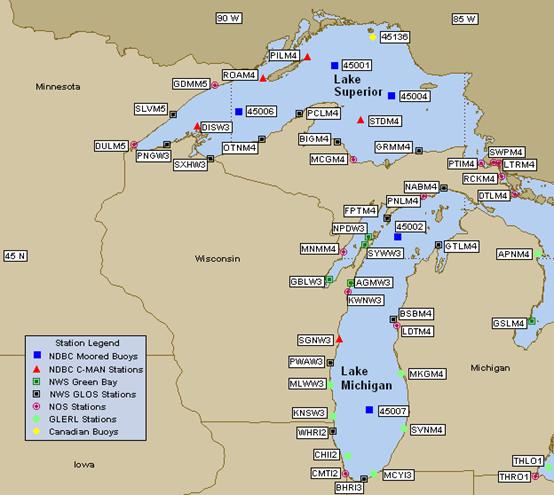
Map
showing location of NDBC Moored Buoy 45007
|
The average wind speed collected by this buoy is taken
once an hour, averaged over eight minutes.The
buoys anemometer is 5 meters over the surface of
Deployment
and Recovery Dates for Buoy 45007
|
|
|
|
|
|
|
|
|
|
|
|
|
|
|
|
|
|
|
|
|
|
|
|
|
|
|
|
|
|
|
|
|
|
|
|
|
|
|
|
|
|
|
|
|
|
|
|
|
|
|
|
|
|
|
|
|
|
|
|
|
|
|
|
|
|
|
|
|
|
|
|
|
|
|
|
|
|
|
|
|
|
|
|
|
|
|
|
|
|
|
|
|
|
|
|
|
|
|
|
|
|
|
|
|
|
|
|
The Air Temperature Data I used is a rolling, twelve-month
average of the air temperature over
I have sorted the data by the rolling, twelve-month average air temperature, to the tenth of a Celsius degree.I have shown the percentage of days with high events (U5 >= 15.0 m/s) and very high events (U5 >= 17.0 m/s) for each average temperature.We see a fairly even distribution of wind events for temperatures between 6.3 and 9.5?C, ranging from 0 to 5%.For months with rolling, twelve-month average temperatures of 9.9 and 10.0?C, however, we see 13% of the days with high or very high wind events.
Below, I have included calculations of hindcasted wave heights corresponding to sample wind speeds from they buoy, using the JONSWAP method.
First well look at the wind from March 25, 2002,
when we had a peak average U5 of 15.0 m/s from a heading of 12?, sending
waves straight towards
First, calculate for the peak wind speed.
1 Hr of Max U10
U5 = 15.0 m/s
U10 = 16.6 m/s
F = 315 km
td = 1 hr
F* = 11,214
t* = 2,127
F*eff = 172
F* > F*eff: Duration limited
H*s = 0.0210
Hs = 0.59 m
Next, well take a longer stretch of time, with a lower average wind speed, to get a fetch-limited wave.
18 hours of U10 >= 12.9 m/s
U5 = 11.7 m/s
U10 = 12.9 m/s
F = 315 km
td = 18 hr
F* = 18,570
t* = 49,278
F*eff = 19,169
F*eff > F*:Fetch limited
H*s = 0.2215
Hs = 3.76 m
Secondly, well look at the wind of November 2, 1992.This day featured a peak average U5 of 11.7 from a heading of 87?, heading for Milwuakee.Again, well calculate an hour of the peak average wind speed and a length of time long enough to force us into fetch-limited waves.
1 Hr of Max U10
U5 = 17.4 m/s
U10 = 22.2 m/s
F = 105 km
td = 1 hr
F* = 2,090.03
t* = 1,590.81
F*eff = 111.18
F* > F*eff: Duration limited
H*s = 0.0169
Hs = 0.85 m
8 hours of U10 >= 20.0 m/s
U5 = 15.8 m/s
U10 = 20.0 m/s
F = 105 km
td = 8 hr
F* = 2,575
t* = 14,126
F*eff = 2,942.15
F*eff > F*:Fetch limited
H*s = 0.0868
Hs = 3.54 m
The conclusion we can draw from the temperature-wind relationship is that calculation of recurrence intervals for periods featuring temperatures higher than those on record will be very challenging, due to the apparent non-linear nature of the temperature storm frequency relationship.Clearly, we should have a larger data record (more sites, data for the entire year, data going back to pre-industrial revolution years) before making any changes to the recurrence interval calculations.