Analysis of Structures on Shoreline of Squaw Bay, Lake Monona
Tim Santiago
Coastal Engineering - CEE 514
About Squaw Bay
Objective
Hypotheses
Paunack Park
Dellwood Circle
Boat Wakes vs.
Water Waves
Determining 100 Year
Water Level
Suggestions for
Structures
Sources and Special
Thanks
About Squaw Bay
During the summer of 2000, the Madison area
lakes recorded the highest water levels ever. As a result, the city
implemented a no wake zone for all of the lakes. During the summer
of 2001, high water levels again interfered with boat traffic on the lakes,
however, this time, the no wake zone was implemented only on a small portion
of Lake Monona, in a small bay in the southeast portion of the lake known
as Squaw Bay.
Map of Squaw Bay
Graph of High Water Levels on Lake Monona
Objective
In observing the structures on
Squaw Bay the objective was to observe the effects of high water on the
shoreline by analyzing two different structures on either side of the bay.
Also, another goal of this project was to gain a better understanding
of the course material discussed over the semester, and combine
these topics with the research and data compiled an observations made.
Hypotheses
Prior to my visit out to
the lake, I devised a number of hypotheses that I thought were possible
reasons to the reasoning to the closing of the bay to boat traffic during
August of 2001. The hypotheses are as follows:
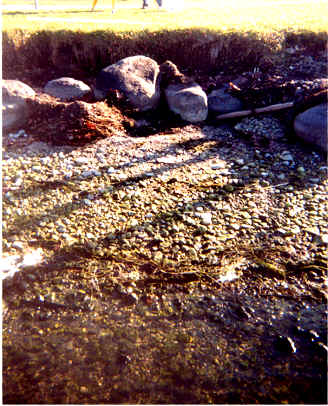
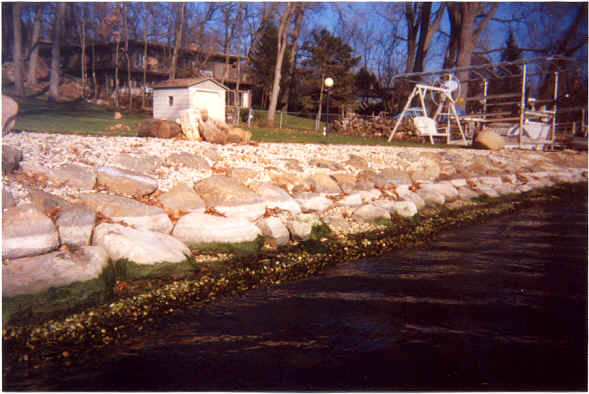
Paunack Park
Paunack Park was located on the south shore of Squaw
Bay. The structure there was a bulkhead built of single row of boulders,
approximately 2 feet in diameter. The structure at the park had eroded
considerably; dirt was eroded as much as 18 inches from the bulkhead itself.
Due to the structures location on the south end of the bay, it was exposed
to the most fetch (or open water area) than any other part of the bay.
Picture of Paunack Park
Profile of Beach
Dellwood Circle
The Dellwood Circle site was located on the northern
side of the bay. The structure there was a sloped revetment built
of a wall of 2 foot boulders near the shore, which tapered to a gentler
slope of smaller (~2 inch rocks) above that. The structure at the
Dellwood Circle site showed little signs of erosion. Due to it's northern
location, Dellwood Circle was exposed to the least fetch in comparison
to any other part of the bay.
Picture of Dellwood Circle
Profile of Beach
Boat Wakes vs. Wind Waves
Wind Waves
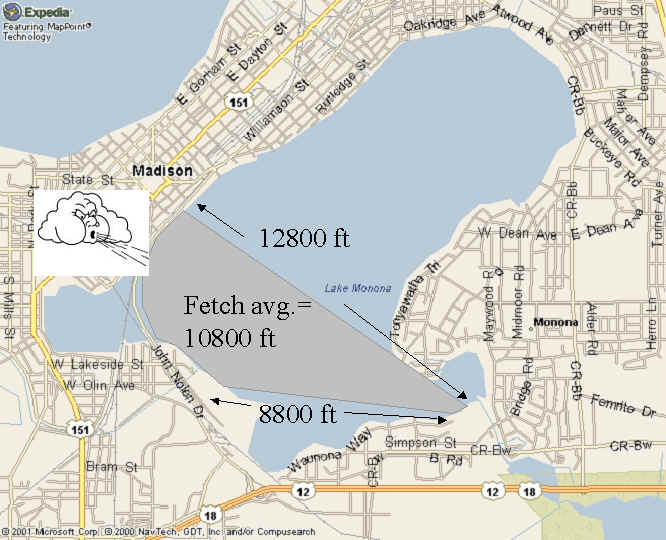
As stated
previously, Paunack Park's shoreline was exposed to more fetch than any
other part of the bay. A wind of 35 mph, blowing over the average maximum
fetch of 10800 feet (2.04 miles) onto Paunack Park, generates a wave height
of approximately 1.4 feet. high. In comparison to the water level
of the lake during the high water levels of 2000 and 2001, it is obvious
that a wave height such as this will have a significant impact on the shoreline.
Since the location of Dellwood
circle is not subjected to much fetch, the wind wave are assumed to be
insignificant in terms of potential damage to the structure.
Picture on maximum potential fetch on Paunack Park
Boat Wakes
In comparison to wind generated
waves, the energy generated by boat wakes are minimal in comparison.
Wind blows constantly, whereas boats only run for a few hours everyday,
and generate only a few waves with each pass. However, boat waves
are a fairly significant factor in areas where wind waves are not much
of a threat. Dellwood Circle is such an example. Boat wake
height is dependent on a number of factors: velocity, distance from
shore, length of boat, and the draft of the boat (the draft, or depth of
the boat beneath water, is quite dependent on speed). A typical wave
train from a boat wake may consist of 10-15 waves, only 3-4 of them will
be of a fairly significant wave height. It is not unlikely that a
boat traveling close to shore (which is unavoidable in Squaw Bay due to
it's small size) will generate a wave that will reach shore at a height
of 1.5 feet. Cabin cruisers and ski boats are notorious for generating
the highest waves among recreational watercraft. Again, as with wind
generated waves, the impact on shorelines is quite significant, especially
in times of especially high water.
Determining 100 year water level
The water levels during the summer of 2000 were
higher than were ever seen before, and it was quite obvious be comparing
these water levels to beach profiles that the coastal structures were not
adequately prepared for water levels this high. As a result, it is important
to figure out how often events like this will occur in order to prepare
for events of this severity in the future.
Data was acquired from U.S. Geological Survey publications
over 40 years (1961-2000), and from this data, an estimate of 100 year
water level was calculated to determine the recurrence interval of events
of this magnitude. The values used were the maximum monthly values,
the average monthly values, and the maximum annual values over the course
of 40 years. These values were used in two separate methods (Gumbel
and Weibull) to determine this 100 year water level value. From these
multiple analyses, the best method (Gumbel method, Mean Monthly data, see below)
shows that the recurrence interval for
the water level during the year 2000 (847.47 ft above sea level, or 2.51
feet above the 40 year average) is expected to occur once every 80 years,
where as the water level for the peak of 2001 (846.55 above MSL, 1.59 feet
above average) would be expected once every 10 years. In comparison
to the 40 years of data that was analyzed, this shows to be fairly accurate.
| 100 Year Water Level Calculations | ||
| Distribution | Data Type | 100-Year Water Level |
| Weibull | Mean Monthly | 8.15 |
| Max Monthly | 8.57 | |
| Max Annual | 8.18 | |
| Gumbel | Mean Monthly | 7.57 |
| Max Monthly | 8.07 | |
| Max Annual | 9.05 | |
It is important to note, however, that the chances of a "100-year" water level occurring become greater as the watershed becomes more developed. With more urbanization on the watershed, more runoff is created, which ultimately finds its way to the lake. Thus, what was once considered t be a 100-year water level 40 years ago is not the case today, as this level will be much more easily attained as urbanization affects the rise of the lake.
Suggestions for Structures
Paunack
It was quite obvious from
analysis of the structure at Paunack Park, that the structure is in much
need of improvement. First of all, the bulkhead is in need of more
protection from wind waves during high water levels, and this can be obtained
through a greater variety in the sizes of riprap, and by making the structure
sloped such that wave energy from wind and boat waves will dissipate during
wave run-up as opposed to crashing into an under-protected shore.
Dellwood Circle
At Dellwood, the structure
seemed to be built quite well, however, it is possible that the structure
was damaged, and since rebuilt after sustaining damage from high water levels during 2000,
and built better to prevent damage from similar events in the future.
In terms of improvements for the structure at Dellwood Circle, it is necessary
to replace the smaller stones at the top of the revetment with larger one
such that washout of the structure does not occur. The two inch stones
are only capable of withstanding the force of a 6 inch wave, and during
high water levels in comparison with high boat traffic, these wave heights
can easily be exceeded - the 1.5 foot wave heights, generated by boat wake,
require cobble 6 inches in diameter or greater.
Sources
- N.G. Bhowmik, et al. 11/1992. Waves Generated by Recreational Traffic on The Upper Mississippi River System. US Fish & Wildlife Service Report 92-SOO3
- U.S. Geological Survey. Water Resources Data Publications, 1961-2000.
- Philip Keillor. 2/09/01. Wave Energy Exposure on Shore of Inland Lakes and Reservoirs Draft.
- N.G. Bhowmik, et al. Aquatic Plant Communities of Upper Mississippi River
- Paul Komar. 1983. CRC Handbook of Coastal Processes and Erosion. CRC Press.
- WDNR. 1991. Boating on Lakes Mendota and Monona. Wisconsin DNR, Madison WI.
- Clarkson Map Company. Map of Lake Monona, Map #1443. Kaukauna, WI.
- http://www.boatwashington.org/watching_your_wake.htm
- http://www.co.dane.wi.us/press_release/exec/20010806.htm
- http://wi.waterdata.usgs.gov/nwis/dv/?site_no=05429000&agency_cd=USGS
Special Thanks
Chin Wu,
Philip Keillor, Keith Puro
Other Important Links
Created by Tim Santiago, December 20, 2001. Email at trsantiago@students.wisc.edu