Lindsay Anderson
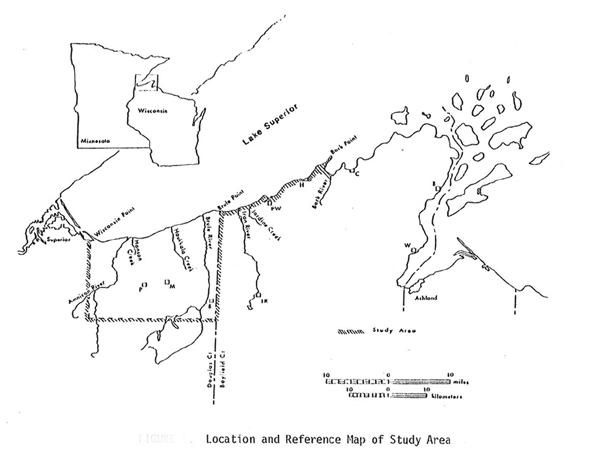
Erosion along the southeastern shoreline of Lake Superior is becoming an increasingly significant problem. Data collected from aerial photographs taken in the 1930s and 1960s-1970s helped to determine historical recession rates for each lithology. Clay was found to retreat at a rate of 0.78 m/yr, water-laid sand and gravel had a rate of 1.89 m/yr, and the rate for sandy till was determined to be 0.12 m/yr. North or Northwest facing coastlines erode faster than others, probably due to the fact that most strong storms and winds come from the northeast. (Johnson, 1995).
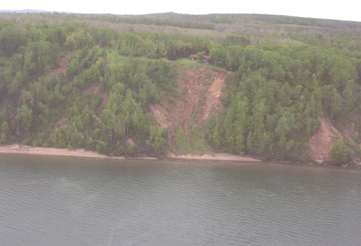
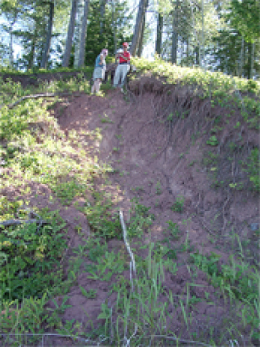
Because natural processes in this
area are rapidly eroding the bluffs, many landowners have lost feet of
land each year. Thus, it is becoming more common to attempt to slow
erosion by installing areas of riprap along the coastline. This installation
is not monitored, but maybe it should be. Studies have shown that
installing riprap can alter long-shore drift of beach sediments, and can
have a detrimental effect of the neighboring coastlines.
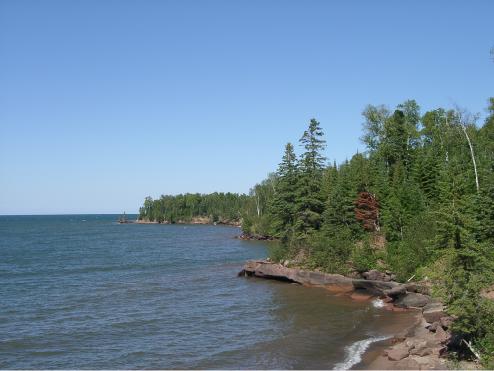
This area of interest incorporates about 25 miles of shoreline. The area is about 60% bluff (on average about 20 feet high), 15% low beach, and 15% bedrock. The vegetation is mostly spruce and birch trees behind the bluff, and about 0-30% vegetation of weeds and shrubs on the bluff and beach. The area is thinly populated; however, recently this part of the lake has become a popular vacation destination, and more people are building homes close to the lake.
As part of their Master's Theses, Mark Johnson and Edward Need identified 3 till units signifying 3 glacial advances. These are, from oldest to youngest:
While the glacial geology of the area is important, for this project the composition of the tills is most significant. In this area in particular, changes in lake level indirectly effect recession rate of the bluff. This strong influence is due to the high clay content of the tills. Water is attracted to clay, and the material becomes very heavy and more likely to fail.
In October, 2001, Mark Miller (Benchmark, GIS) completed a study to determine recession rates on the southern shoreline of Lake Superior. In this study, he compared historical aerial photographs from 1938 and 1990 to determine the bluff tops at each time. He then put the photographs into ArcView GIS, overlaid the lines drawn at each bluff top for the two times, and measured the distance between the two bluffs.

Example of recession analysis
(source: Miller, 2001)
In the late 1970s, the Wisconsin Coastal Management completed a study analyzing the slope stability of the southern Lake Superior Shoreline. During this study they completed three slope profiles per mile. They used this profile data to analyze the stability of each slope using a method of slices. By using this method one can measure the force on a vertical "slice" of the slope. Then, by calculating the forces acting on different groups of these slices, one can determine the most likely place that the slope will fail.
The likelihood of a slope failing is measured by a "factor of safety" or "FS." For slope stability, a FS equal to or greater than about 1.1 is considered safe.
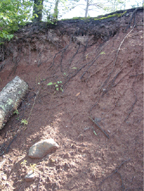
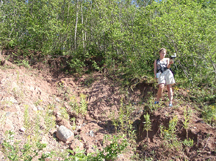
Last summer I completed field work revisiting the sites
from the 1970s slope stability study. I compared historic and current aerial
photographs to find areas where riprap has been added within the past 25
years. Once the locations were determined, I measured profiles at
each site and located each with a GPS.
The profiles were then analyzed using the same method
that was used historically, but this time with the help of the STABL program.
This program computes the factors of safety given the profile, material,
and water level data, allowing the user to chose where the circles (groups
of slices) are chosen. Once I completed this analysis I could compare
the factors of safety to determine the effectiveness of the riprap.
In order to compare the differences in shoreline stability,
I looked at three sites where riprap was installed within the past
25 years. I did this by comparing calculated factors of safety, where
FS greater than 1.1 is considered safe. In the following section
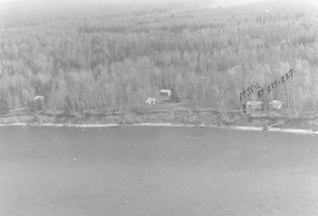
are historic and current (late 1970s and 2001) oblique aerial photographs
and the slope stability analysis of an example site.
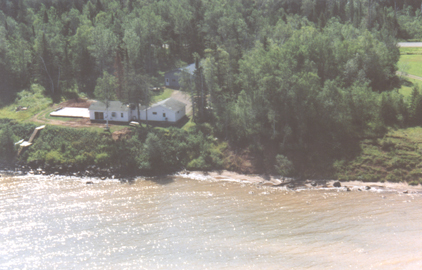
Aerial Photographs
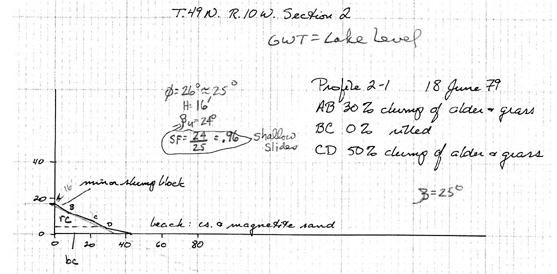
Slope Stability Profiles
(source: WI Coastal Management)

Site 1: Profile Data (2001) showing the profile, and the factor of safety
determined to be 1.39. Thus, this is considered an unstable slope.
Site #1, which is also the example site used for the results section, shows that with the implementation of riprap, the factor of safety of the shoreline increases dramatically. In 1977, the FS was 0.96 (an unsafe slope), and in 2001, after homeowners placed riprap in front of their house, the FS increased to 1.39. Other sites analyzed produced similar results, with increased factors of safety after riprap was installed. While it is hard to determine that this increase is entirely due to to the riprap, I believe that this project has helped to reaffirm the belief that riprap will protect the shoreline and slow erosion.
It should be noted, however, that homeowners should be
careful when installing riprap because of the changes that the riprap may
initiate on the currents along the coast. During my work along the
shoreline of Lake Superior, I noticed that in some cases, homeowners adjacent
to areas of riprap suffered abnormal erosion or deposition. Therefore,
the use of riprap should be monitored due to the effect it can have on
neighboring properties.
This study was a small, qualitative project. Since
the southern side of Lake Superior is becoming more popular, I believe
that erosion on the shoreline will become a significant issue. The
effect of riprap has been studied, but not significantly on Lake Superior.
This location provides a great opportunity for engineers and scientists
to recognize a problem before it becomes too large. The next step
is to begin quantitative studies to continue to analyze the effect of riprap
on adjacent property.
References
Ben Belfadhel M, Lefebvre G, Rohan K. Comparison and evaluation of different riprap stability formulas using field performance. Journal of Waterway, Port, Coastal, and Ocean Engineering-ASCE 122 (1): 8-15 Jan-Feb 1996
Brown, Lisa, Influence of Water Level, Wave Climate and Weather on a Coastal Recession along a Great Lakes Shoreline. UW Masters Thesis, 2000.
Johnson, Mark D. 1980. Origin of the Lake Superior Red Clay and Glacial History of Wisconsin's Lake Superior Shoreline West of the Bayfield Penninsula. Master's thesis, University of Wisconsin, 108p.
Maynord, ST. Sizing dumped rock riprap Journal of Hydraulic Engineering-ASCE 124 (6): 652-652 Jun 1998
Need, Edward A. 1980. Till Stratigraphy and Glacial History of Wisconsin's Lake Superior Shoreline: Wisconsin Point to Bark River. Master's thesis, University of Wisconsin, 140 p.
Novak P. Roughness of loose rock riprap on steep slopes Discussion. Journal of Hydraulic Engineering-ASCE 125 (6): 670-671 Jun 1999
Rasid H, Baker D, Kreutzwiser R.D., Coping with Great-Lakes Floor and Erosion Hazards-Long Point, Lake Erie, vs. Minnesota Point, Lake Superior. J Great Lakes Research 18(1):29-42 1992
Ruggiero, P, and McDougal, W.G., An Analytical model for the prediction of wave setup, longshore currents, and sediment transport on beaches with seawalls. Coastal Engineering. 43 (2001) 161-182.
Shore Erosion Study (Technical Report): Shoreline Erosion and Bluff Stability along Lake Michigan and Lake Superior Shorelines of Wisconsin. Appendix 9, July 1980.
Worman A, Xu SL. Stochastic analysis of internal erosion in soil structures - Implications for risk assessments. Journal of Hydraulic Engineering-ASCE 127 (5): 419-428 MAY 2001
This website was completed as part of a final project for a Coastal Engineering (Civil Engineering 514) course through the College of Engineering at University of Wisconsin-Madison
For more information to on the project, please
contact Lindsay Anderson at: landers@geology.wisc.edu
For more information on the class, please go
to: Coastal_Engineering
Home Page
website updated on December 18,
2001 by Lindsay Anderson
Back
to Top