 Crystal Lake
Created by Eric Riedner for Professor Chin Wu's CEE 514 - Coastal Engineering Class
Revised by Chin H. Wu
Introduction
Shoreline erosion is a major concern to many landowners with lake property because it causes a decrease in property value and sometimes endangers structures that were built too close to the water. The main cause of shoreline erosion is waves that through continuous battering of the shore slowly erode away rock and soil. These waves are often caused by wind, but in some areas boat generated waves are also a major contributor to shoreline erosion. This report investigates the effects of boat generated waves on shoreline erosion on one such lake in Wisconsin.
Crystal Lake is a fairly small lake
in South-Central Wisconsin located halfway between Fond du Lac and Sheboygan.
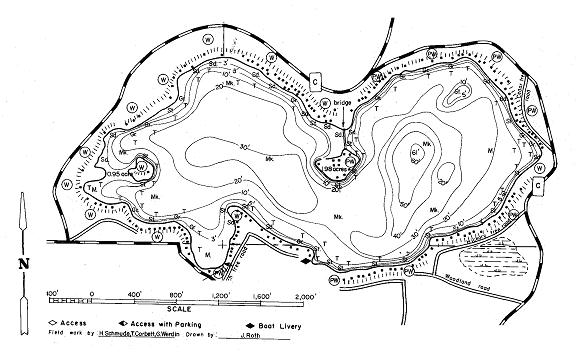
The lake has an area of 152 acres with a mean depth of 25 feet and a maximum
depth of 61 feet [www.lake-link.com]. A topographic map of the lake
can be seen in the figure below. The lake is surrounded completely by houses
and cabins that are squeezed close together around the lake. The
lake is one of the most beautiful in the area with its clear water and
surrounding scenery and because of this it is increasingly becoming more
crowded. Along with the increased popularity of the lake is an increased
number of recreational boats on the lake, which are used primarily for
waterskiing and tubing. These activities have become an important
part of lake, but it is possible that the
waves created by these boats are damaging the shoreline of Crystal Lake.
The objective of this study is to evaluate the effects of wind generated
waves and boat generated waves on shoreline using some empirical models
and laboratory studies.
Crystal Lake
Calculations
Overview
The approach to quantify the effects
of boat generated waves is based upon the draft report by William Fitzpatrick
at the Wisconsin Department of Natural Resources. The paper was in
rough draft form and was created in order to determine the effects of boat
waves on the shoreline of Lake Mendota. The model used a comparison
of boat generated waves to wind generated waves in order to determine if
the energy delivered to the shoreline by boat waves is significant with
relation to the energy delivered by wind waves over the course of one day.
The main steps in determining these two values are calculating wave heights,
converting the wave heights to wave energy, and determining the number
of times these waves strike the shore.
Our approach will combine CEE 514 notes, Fitzpatricks paper, and Robert Sorensen report that looks into the effects of boat generated waves on the Upper Mississippi River. Sorensens report explains the physics of boat generated waves and compares a number of theories that are used to determine wave heights created by boats. For this report all of these theories were considered. We found that the method created by N.G. Bhowmik fits an analysis on Crystal Lake the best. Bhowmik uses an empirical equation derived from experiments involving boats of similar size, speed, and type that are commonly seen on Crystal Lake, using visual observation records.
The most difficult part of using
these methods and equations is attempting to put a single value on many
of the different parameters needed to create two numbers in the end that
are used to compare the energies of the two kinds of waves. This
report recognizes the shortcomings of singularizing these values by averaging
and making undocumented assumptions and it should be stressed that the
final values are meant to only give a rough comparison between the effects
of wind and boat waves.
Wind Waves
Wind wave height can be determined
using the following equation [Fitzpatrick].
Hs = (0.283U2)/g)*(tanh(0.530(gd/U2)0.75))*(tanh((0.0125(gF/U2)0.42)/(tanh(0.530(gd/U2)0.75))))
Hs= significant wave
height in feet, the value that is solved for
U = wind speed in ft/s = 14.7 ft/s
(10mph) which is the average value for the state of Wisconsin [NOAA]
F = fetch length in 2650 ft
d = depth in feet, average lake
value determined from a topographic map = 25 ft
g = 32.2 ft/s2
Using the parameters in the given equation, Hs was determined to be 0.29 ft or 0.09 m.
As a check this value can compared to one created by the SMB (Sverdrup, Munk, and Bretschneider) method. This value is determined using the fetch-limited approach instead of the duration-limited approach due to the small size of the lake and the average wind value that is used, which is sustained for a relatively long period of time.
(gF)/U2= (9.81 m/s2 * 808 m)/(4.48 m/s)2 = 394
Using the graph associated with the SMB method, gHs/U2 = 0.042, and Hs = 0.086 m = 0.28 ft. This value is consistent with the estimated one using Fitzpatricks equation.
In addition, the SMB method can also calculate the period, T, of the wind waves.
Using the graph associated with the SMB method, gT/(2*pi*U2) = 0.4, and T = 1.1 seconds.
Following the CEE 514 Notes, The following equation can be used to determine the weighted average energy, Ew, of a wave given the significant wave height, i.e.
Ew = 1/16 * r *g*Hs2 =0.613*Hs2 = 0.613*0.086^2 = 0.0045 kN/m2
Dividing Ew by a wave period T, the wave power, Ep, of wind waves can be computed, i.e.
Ep = Ew
/T = 0.0045/1.1 = 0.004 kN/m2/sec
Eday
= Ep*86400 = 0.0045*86400 = 388 kN/m2
Boat Waves
Boat generated wave heights can
be calculated using the following equation that was created by Bhomik et.al.
in 1991 and was summarized and evaluated by Sorensen. This equation
was created using a regression analysis from a selection of boats that
are very similar to those found on Crystal Lake.
Hm = 0.537*V-0.346*x-0.345*Lv0.56D0.355
Note that this equation implies that wave height would decrease if vessel
speed increases!
(This only works for planing hull boat)
Hm = maximum wave height,
the value that is solved for
V = vessel speed is 9 m/s. This
speed was determined by visual inspection and by suggested water skiing
speeds (www.waterski.about.com), since water skiing and tubing are the
main source of boat traffic on the lake.
x = distance to the measurement
point in meters = 100 m. This distance was estimated by observing that
boats on the lake tend to travel in a circular direction around the lake
traveling close to shore so that more boats can operate at one time with
skiers in tow.
Lv = length of the boat in meters
= 5.5 m. This length was determined through visual observation and
researching standard sizes of recreational boats. Almost every boat
on the lake that created significant waves is near the standard recreational
boat size of 5.5 m.
D = draft of the boat in meters
= 0.4 m. This value was estimated by interpolating Bhowmiks data
related to boat speed, size, and type.
Using the parameters in the equation, Hm was determined to be 0.10 m or 0.32 ft.
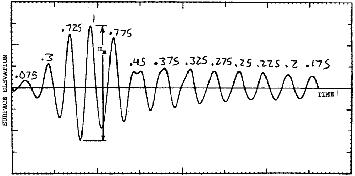
While standing on shore there are
approximately 13 measurable waves created by a passing vessel [Sorensen].
The figure below shows these waves and the relative height of each compared
to the Hm. The equation E = 9.80*(H/2)2/2, which determines
the energy of the wave given the wave height, was incorporated with this
typical wave train in order to determine the total energy delivered to
the shore by a passing boat.
Typical vessel generated wave record with wave size relation to Hm denoted
E=0.1138*(0.075*Hm)2+0.1138*(0.3*Hm)2+0.1138*(0.725*Hm)2+0.1138*(Hm)2+0.1138*(0.775*Hm)2+0.1138*(0.45*Hm)2+
0.1138*(0.375*Hm)2+0.1138*(0.325*Hm)2+0.1138*(0.275*Hm)2+0.1138*(0.25*Hm)2+0.1138*(0.225*Hm)2+
0.1138*(0.2*Hm)2+0.1138*(0.175*Hm)2
E = energy exerted by a passing
boat on a point on shore in kN/m2
Hm = maximum wave height
in meters = 0.10 m
Solving the equation, E = 0.0033 kN/m2.
In order to convert the boat wave
energy from one pass into the energy created per day, estimates were made
concerning boat traffic on the lake. Through visual observations
it was estimated that a boat passes a point on the shore every 3 minutes
during the peak 8 hours on the weekend. During four of the weekdays
it was estimated that a boat passes once every 10 minutes during the peak
4 hour period and on one weekday no motorboats are allowed on the lake.
Using these assumptions it was determined that there are 60 boat passes
on the lake during the average day.
The energy created by boat waves
per day can then be computed by using the following equation:
Eday
= E*(boat passes in a day) = 0.0033*60 = 0.20 kN/m2
Results
(1) Energy Viewpoint:
These calculations
show that the energy created by wind waves in one day, 388 kN/m2,
is far greater than the energy created by boat generated waves in one day,
0.20 kN/m2.
The energy approach assumes wind continues generates waves for 24 hours,
which is not true. Also, the approach adopted here does not take into account
of shoaling and bottom effects. In addition, the boat generated waves 0.20
kN/m2 also neglect
the long resistance of wakes generated by boats. Therefore, the energy
approach usually may mislead the results.
(2) Maximum Wave Height Viewpoint:
The wave heights generated by both wind
and boat are comparable to each other, i.e 10cm. If boats get
closer to the shore (say 100ft), the boat generated waves can reach to
15cm wave height. Normally, the extreme wave height plays an important
role in damaging shoreline or structures. Thus one may easily conclude
that boat generated waves is the main factor to cause shoreline erosion.
Discussion:What is missing?
As we know that
recreational boating is important to the people who use the lake. The results
shown in the above study may contradict to each other! Therefore,
a detail study of monitoring shoreliner response to boat generated waves
and wind waves is definitely needed.
References
Bhowmik, N.G., Soong, T.W., Reichelt, W.F., and Seddik, N.L. (1991). Waves generated by recreational traffic on the Upper Mississippi River system, Research Report 117, Department of Energy and Natural Resources, Illinois State Water Survey, Champaign, IL.
Crystal Lake, Sheboygan County. www.lake-link.com. (2001).
Fitzpatrick, William. (2000). Boat and Wind Energy Screening Model, Review Draft. Wisconsin Department of Natural Resources.
How Fast Should You Go. http://waterski.about.com/library/weekly/aa091500.htm. (2001)
NOAA Web Site for Plymouth Wisconsin. www4.ncdc.noaa.gov. (2001)
Sorensen, Robert M. (1997). Prediction
of Vessel-Generated Waves with Reference to Vessels Common to the Upper
Mississippi River System, Upper Mississippi Illinois Waterway System
Navigation Study, ENV Report 4.