Circulation
Patterns of Lake Mendota as Observed from a Physical Model
Written byRebecca
Rewey
under the guidance
of Professor C.
Wu
at theUniversity
of Wisconsin-Madison
Abstract
--- Objective
and Hypothesis --- Coastal
Environment of Targeted Area --- The
Model --- Approach
to the Issues --- Results
and Discussion --- Conclusion
--- References
Abstract:
The goal
of my project was to observe the water circulation in Lake Mendota using
a physical model. The model I used was made by a student for her
coastal engineering project a year ago. Thank you Erin Hubbard.
The model is made out of plaster and plywood. My first goal was to
make sure the model was waterproof. My first attempt to do this failed.
I used a two-part epoxy but this did not seal the thousands of tiny holes.
I was then forced to line the bottom of the model in a thin sheet of plastic.
This worked but was not ideal.
There are
several reasons to use a physical model. These are outlined below.
Physical
goals of a physical model include
-
Physical models
seek qualitative insight into a phenomenon not yet described or understood.
-
They are used
to obtain measurements to verify or disprove a theoretical result.
They
are also used to obtain measurements for phenomenon that are so complicated
that they have not been analyzed using a theoretical approach.
Some
advantages of a using a physical model include
Nature
is integrated into the equations which govern the phenomenon (no simplifying
assumptions are used and no unknowns are omitted as with numerical modeling)
The
size of the model is much smaller than the prototype so data can be obtained
much easier.
Some
disadvantages include
Scale
effects are introduced which may affect various forces such as surface
tension.
The
model is generally more simplistic than the prototype.
Objective
and Hypothesis:
My objective was to determine the
effects of wind on the water circulation in Lake Mendota. The circulation
patterns can help explain sediment deposits and areas where erosion is
an issue. I decided to focus on the northern region of the lake where
the Yahara River enters the lake. I narrowed my study to determining
the affects of both wind direction and speed. I hypothesized that
both the wind and winds' direction would play a major role in the water
circulation. I guessed that no wind at all and the wind from the
South would inhibit water circulation, while the wind from the North would
evenly distribute the waters from the Yahara River. I also thought
that the winds from the East and West would concentrate the waters from
the Yahara River at the opposite end. (See the Conclusion
section for what really happened!)
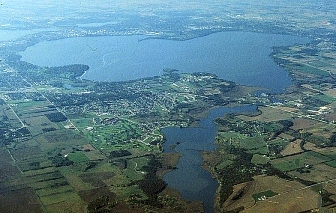
Coastal
Environment of Targeted Area:
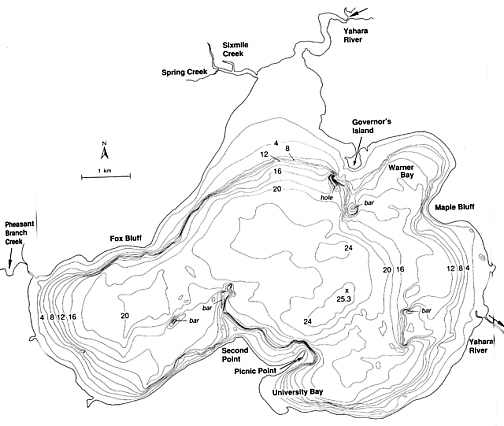
I chose to focus on the North side
of Lake Mendota where the Yahara River enters Lake Mendota. Notice
how this area is relatively flat like a "shelf" and then there is a steep
drop off to form a "ridge." (Note that this map is in meters.)
The
Model
For a model
to replicate the prototype, geometric and dynamic similarity must be met.
In other words the model and prototype have to look the same and the forces
in each have to have the same relative magnitude. This model is a
distorted model meaning that the length scale and vertical scale are not
equal. Also, because this model is a free surface model, surface
tension and viscous forces are less important than gravitational or inertial
forces. For this reason, Froude's Number is dominant. The following
is a table showing the scale of the model to the prototype.
| Characteristic |
Dimension |
Model to Prototype
Scale Relation, r |
| Length |
L |
Lr
= 1:9600 |
| Height |
L |
Lh
= 1:120 |
| Area |
L2 |
Ar
= Lr2
= 1:92160000 |
| Volume |
L3 |
Vr
= Lr2Lh
= 1:110, 592,000,000 |
| Time |
T |
Tr
= Lr1/2 =
97.98 |
| Velocity |
L / T |
Vr
= Lr
/ Lr1/2
= 97.98 |
Approach
to the Issues
In order
to test my hypotheses, I used pink dye to trace the circulation patterns.
In order to introduce the dye I used a pump and introduced the dye as if
it were the Yahara River. I then used an industrial sized lab fan
and a transformer to control the wind speed. I recorded the patterns
at intervals using a digital camera. I ran five tests with the intentions
of running at least ten. Time became a factor and I was not able
to test the effects of wind speed, only direction. While keeping
the wind speed and the inflow from the Yahara River constant, I tested
the effects of the wind; my tests included no wind at all as well as wind
from the North, South, West, and East.
Results
and Discussion:
Test
No.1: No Wind
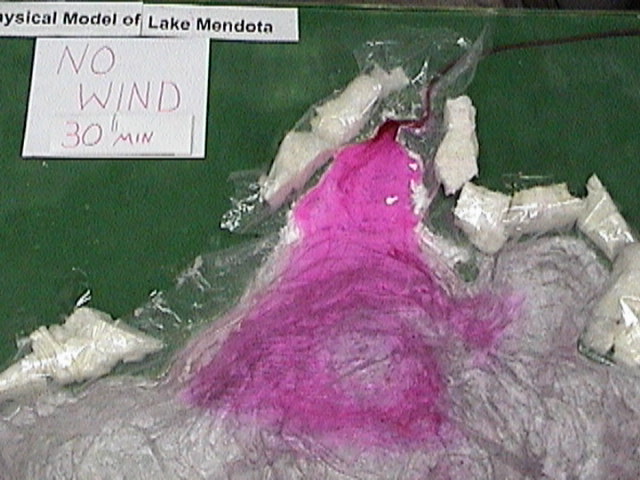
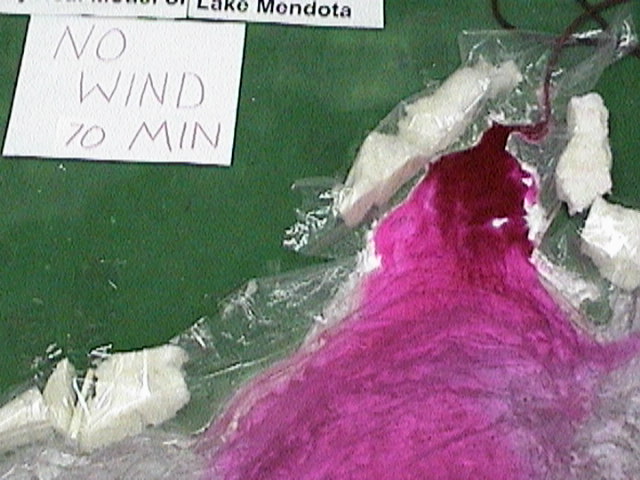
This test ran for a total of 70
minutes. After 30 minutes the dye was circulating counter clockwise
as it passed over the steep ridge. And after 70 minutes the dye began
to build up and form "fingers." These fingers may have been due to
either the ridge itself or may have been attributed to the water equilibrating
to the temperature of the room (the water I was using for the lake water
and the dye was from a hose and was rather cold).
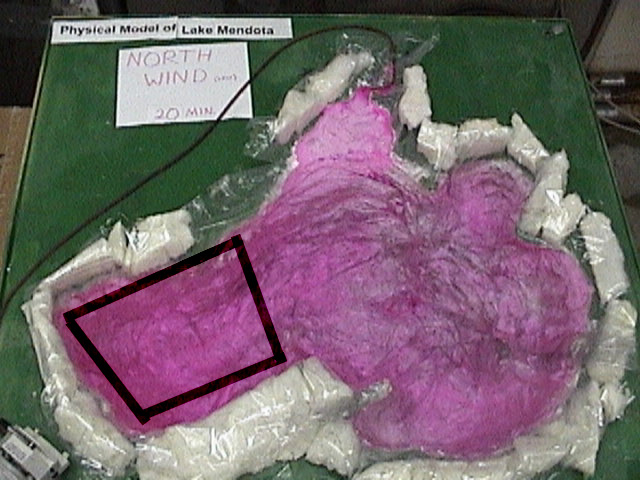
Test No. 2:
North Wind
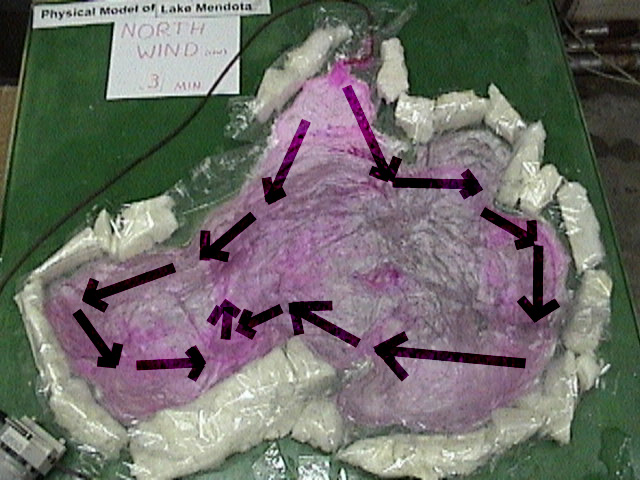
The arrows in the picture on the
left show the direction the dye was moving after only three minutes.
After 20 minutes the dye was concentrated in the west bay, as outlined
in the picture on the left.
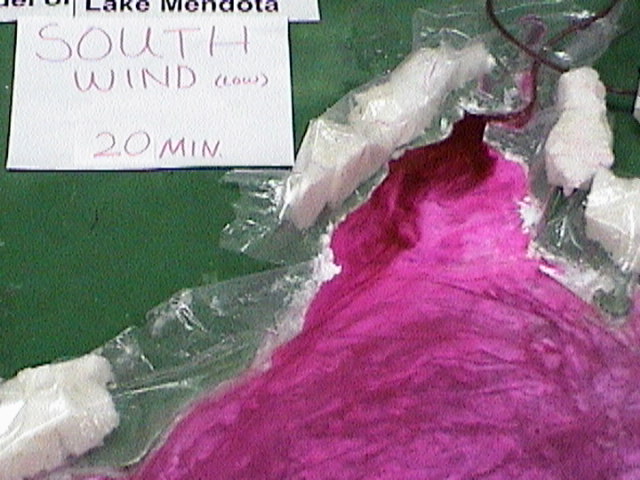
Test No.3:
South Wind
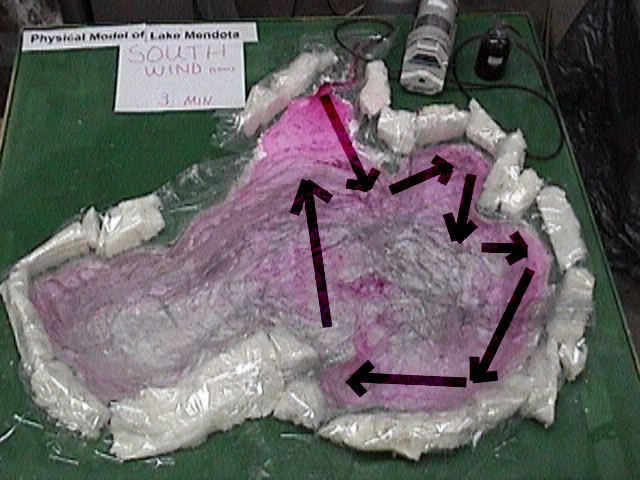
The arrows on the picture on the
left show the direction of the flow after 3 minutes. After 20 minutes
the dye was almost completely mixed throughout the lake and was beginning
to concentrate near the Yahara River.
Test No.4:
West Wind
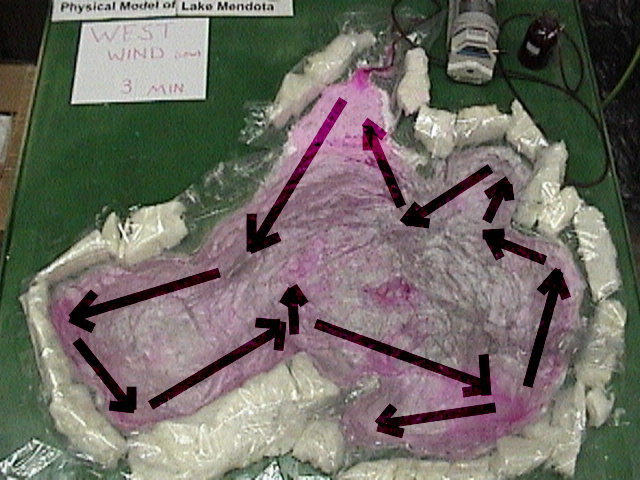
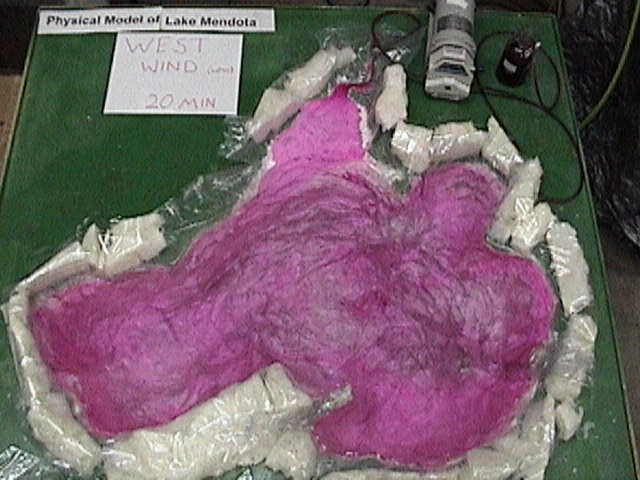
Again, the arrows in the picture
on the left show the direction of the flow. This case seemed to result
in the most even distribution.
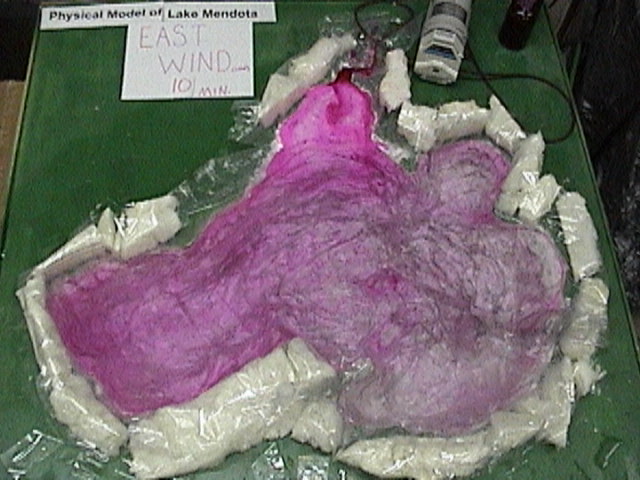
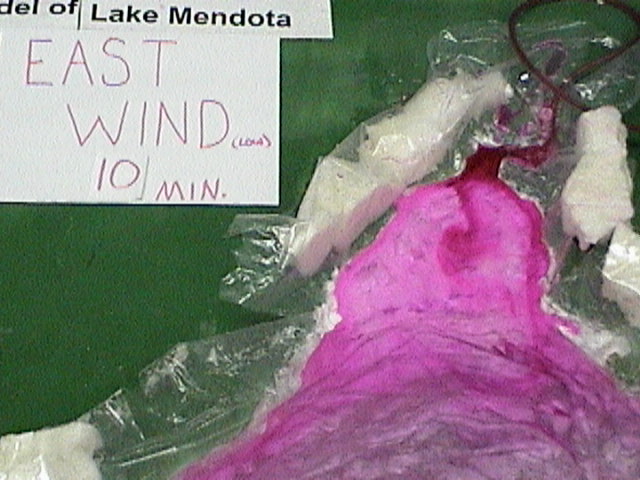
Test No.5:
East Wind
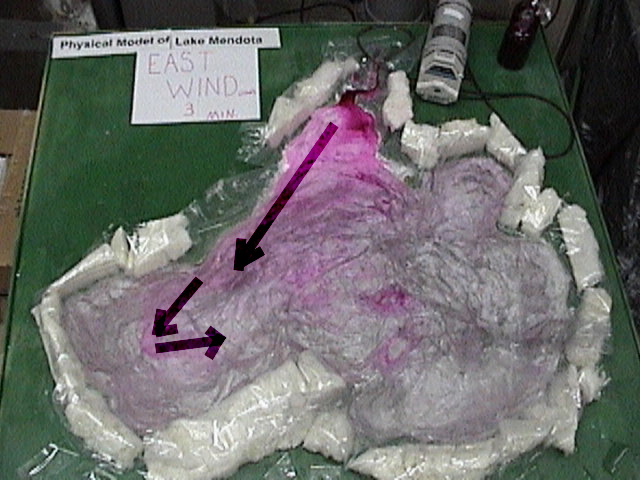
The arrows should be self explanatory
by this time. This case was the most interesting. After 10
minutes the dye started to circulate clockwise on the shelf near the Yahara
River. There is a closer view of this below. The water seemed to
just pass over the ridge and then would get caught by the wind from the
East and forced back onto the shelf.
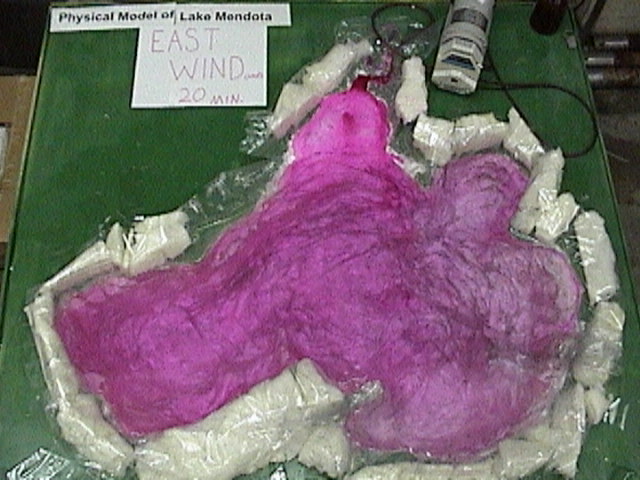
After 20 minutes the dye became
concentrated towards the west side of the lake.
Conclusion:
The results
from my project are qualitative because of the limitations of a physical
model. I have proven that the wind direction has a definite impact
on circulation. The winds from the East and South (as well as no
wind at all) impede circulation from the Yahara River into Lake Mendota.
Winds from the West and North help to circulate the water from the Yahara
River into Lake Mendota. As far as wind speed is concerned, I did
not have time to evaluate this realm of circulation.
References:
Kamphius,
J.W. (1985), Physical Modeling in Coastal Engineering, (R.A. Dalrymple,
Editor), A.A. Balkema, Rotterdam
Erin
Hubbard, (1999), Physical Model of Lake Mendota, http://www.cae.wisc.edu/~chinwu/CEE514_Coastal_Engineering/2000_Students_Web/Erin_Hubbard/Modeling_lake_Mendota.htm
Kamphius,
J.W. (2000), Introduction to Coastal Engineering and Management,
World Scientific Publishing
Wisconsin
Department of Natural Resources, Nonpoint
Source Control Plan
for the Lake Mendota Priority Watershed Project, (May
1997), http://www.dnr.state.wi.us/org/water/wm/nps/plans/mensum/mendota.htm
Center
for Limnology, UW-Madison,http://scifun.chem.wisc.edu/chemweek/lakelore/lakelore.html
Beletsky,
D. (1999) Journal of Great Lakes Research Volume 25, Great Lakes
Environmental Research Laboratory http://www.glerl.noaa.gov/data/char/circ/mean/mean-circ.html