Written
and Prepared by Andrew Veine
for
Professor Wu, Ph.D.
University
of Wisconsin at Madison
Department
of Civil and Environmental Engineering
CEE
514 Fall 2001
Objectives
First
I wanted to find an appropriate amount and arrangement of equipment to
serve as a wave gauge for the characteristics on various types of water
waves. I also wanted to arrange a suitable testing environment, so I could
limit the amount of variables to consider when interpreting the output.
My last objective for the project was to get the wave gauge calibrated
such that when the future work of taking the gauge out into the field occurs,
it would be all set to go.
Approaches
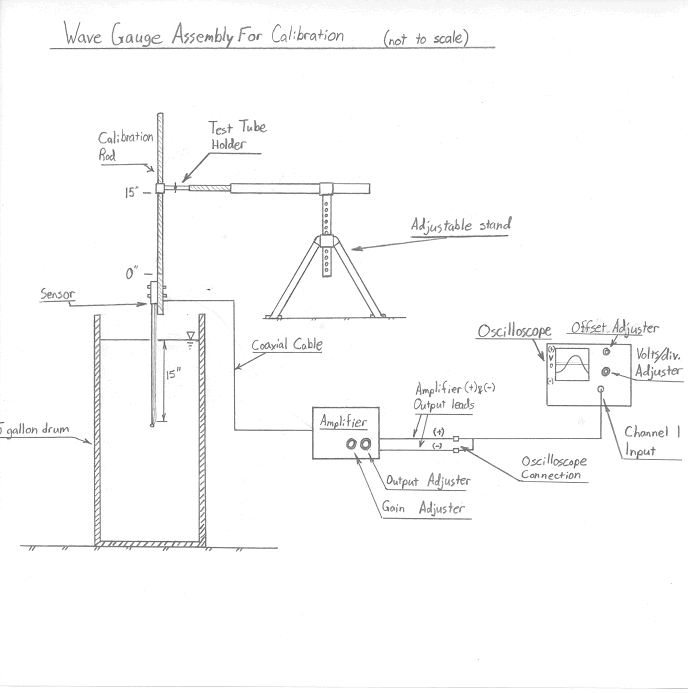
For the assembly of the wave gauge, I first needed to determined the key elements that were needed to register information. these included:
The Amplifier
The Oscilloscope
sensor length
wire tension
sensitivity
The wire component for the sensor is what takes in the water depth information.
The amount of submergence of the wire in the water determines the information
output. This is based on the amount of capacitance the wire has. Higher
voltage magnitudes are observed with more wire submergence. The thickness
of the wire must be such that the voltage magnitude isn't too great for
the wave gauge arrangement to register. The thickness of the wire also
causes complications with water. The thicker the gauge of the wire, the
more water will adhere to it causing discrepancies with observed voltage
values. The wire length is important due to the ability of the wave gauge
equipment to function properly. The settings of the equipment may only
be able to handle a certain length of wire in combination with wire gauge.
Wire tension was one last concept that wasn't thought of until the end
of the work for this project. It is one idea that may explain the difference
between the two calibration curves seen below. Finally the sensitivity
of the probe was considered. Later it was found that the amount of voltage
that I was working with was very low. The assembly of the sensor had to
be such that the only capacitance in the sensor had to be just the wire
and the water. Touching the support rod that held the wire in place with
my finger showed a change in voltage on the oscilloscope. This support
rod had plastic screws attached to it to fasten the wire in place without
coming in contact with the support rod.
The amplifier proved to be quite a learning experience for me. I needed to find the right settings on the amplifier that coordinated with assembled sensor characteristics to produce readings on the oscilloscope that would be most conducive for calibration. Through some time and effort and a little referencing with some basic electrical circuitry characteristics I found that the component that the amplifier that I had in my possession had two principle settings that I would have to adjust. The gain and the output settings were the key settings that would eventually give me something to work with on the oscilloscope.
The oscilloscope isn't the most practical piece of equipment for what I was using it for. My first choice was an analog recorder which may have produced more accurate results. The analog recorder was, unfortunately, dis-functional due to a broken belt used to make the pen move on the graph paper. The Oscilloscope was very intimidating in appearance to me compared to the analog data recorder with all of its various components. Through patience it proved to be very easy to work with. The settings that I worked with, The offset and the voltage per division adjusters determined the placement and the magnitude of the output from the amplifier.
The characteristics and settings of all three components needed to be such
that I utilize the full range of the graph on the oscilloscope such that
I could make more precise and accurate readings. Another important avenue
I needed to explore was whether or the depth of sensor immersion in water
was linearly related to the voltage seen on the oscilloscope. This would
require testing the wave gauge at various component settings. A linear
relationship would make it easier to figure a water depth
Finally a suitable setup for testing the wave gauge needed to figured out
to create data that would limit factors interfering with test results.
Also this setup would have be capable of producing accurate data out in
the field once testing was finished.
Results
Calibration

With the
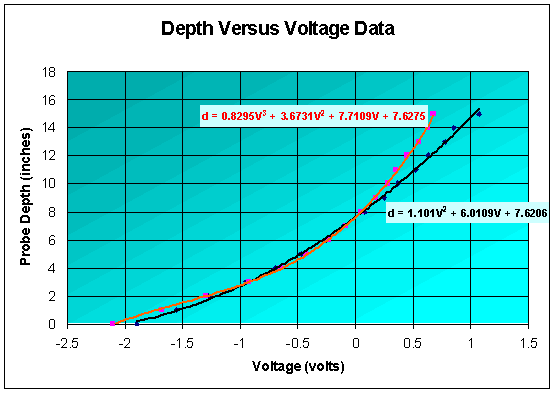
above assembly, calibration ensued. There was no distinct linear relationship
between the voltage magnitude and the depth of emersion of the wave gauge
sensor. Various settings with the amplifier gain and output settings and
the oscilloscope's volts per division setting yielded 2nd and 3rd order
relationships. The two curves below represent the general trend that was
seen with the different arrangement of settings. With the offset of the
oscilloscope used to zero the voltage with a corresponding depth of 7.5
inches, The voltage read at 15 inches was anywhere from 50-70% of the voltage
read at 0 inches depth. The red best fit line represents data received
with the amplifier output and gain settings set at 830 and 335 respectively.
The black best fit line is from the gain set to 575 and the output at 300.
The higher output depth to voltage relation is approximated with the equation
shown in red and the lower output depth to voltage relation is shown by
the equation in black.

For the higher output settings, lower gain values influenced the noise on the graph, producing a fuzzy line rather than a fine line. The gain had higher ranges with lower output values that produced fine lines on the oscilloscope. With the gain held constant and the output decreasing, lower voltage fluctuations were seen on the oscilloscope. Properly increasing the gain compensated these lower voltage fluctuations due to the decrease in output. The gain and output settings for the to curves above are indicative of the other tests which produced a fine line on the oscilloscope while utilizing the full range of the its graph. The other tests were just minimum and maximum voltage readings with 7.5 inches of depth as the zero reference voltage.
The wire
that was used with the sensor had a diameter of 0.005". Larger and smaller
gauge wires were used. The larger gauge wires weren't narrow enough to
register their complete length. Voltage fluctuations only occurred with
a fraction of their length. The smaller gauge wires were very hard to work
with, They kept breaking during their installation in the sensor. The 0.005"
size wire wasn't much easier to work with but it was still used to produce
results. It's size also gave desirable results for various amplifier output
settings.
Discussion
Towards
the end of the work performed I wanted to see how reliable the black calibration
curve was. A week after the data for the black curve was produced I decided
to try and reproduce the black curve. This is why I included the red curve.
The reproduced data for the black curve showed an overall reduction in
voltage fluctuation. I then tried to find another set of parameters to
give me the red curve which seems to have 3rd order relationship rather
than a 2nd order. Some reasons that I came up with to explain this problem
are vague. Power usage in the building I was in and power surges, (i.e.
pump turns on and runs for awhile). I then determined that wire tension
effects did not entirely account for the differences, only a small portion.
With the solving of this problem, the results from testing the commercial
wave gauges and my wave gauge should be similar.