CEE 514 Term Project
Wave Power and Coastline Recession Rate:
Are they Related?
by Lisa Brown
Detailed shore
elevation surveys and nearshore lake bottom profiles have been carried out at
four coastal sites on the Great Lakes.
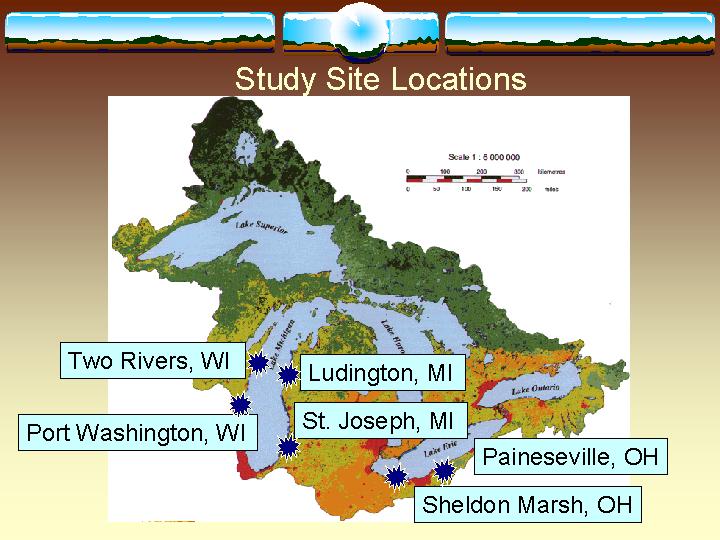
Two sites are in Wisconsin near Two Rivers and Port Washington. One site is near St. Joseph, MI and the
fourth is near Painesville, OH. The
shoreline at all four sites consists of till bluffs between 30 and 140 feet
high. Shoreline retreat due to
recession of the till bluffs has been recorded, to varying extents, at all four
sites. Data collected at NOAA’s moored
buoys located near the sites include wave data summaries of the dominant wave
period and significant wave height between 1981 and 1993. Buoy data summaries from the nearest buoys
to the study sites were used to estimate the peak incident wave height and
period. The wave breaking depth was
calculated based on these deep water wave characteristics and compared to the
depth of longshore bars in the surveyed profiles. The breaking depths agreed with the depth of the longshore bars in
the two Wisconson shore reaches along which relatively few coastal structures
have been placed. The breaking depths
are calculated to be half of what the measured bar depths are for the remaining
two, more developed shoreline sites.
This is consistent with the expectation that a partially standing wave
may develop in the presence of onshore parallel coastal structures and cause
the breaking depth to be twice what would be expected of a progressive wave
approaching an untouched coastline. The
run-up is calculated based on the beach slope and the incident wave
characteristics. As run-up is higher
for steeper beaches and steeper beaches are built under calm wave action,
run-up may not be a relevant parameter to predict bluff recession. Wave power, however, is found to show a
positive relationship with recession rate based on Two Rivers, WI profiles.
The Great Lakes present numerous
technical challenges for coastal engineers.
The prediction that population, employment, and per capita income in the
Great Lakes Region will double between 1970 and 2020 enhances the importance of
the role of coastal engineers who attempt to predict the timing of future high
and low water levels, to establish setbacks for new developments, and to
isolate areas at risk of flooding and/or bluff erosion. The erosion of the bluffs on the Great Lakes
affects people on a multitude of levels.
Homeowners whose house and property are on the shores of these lakes
stand to lose some of their land and, even worse, their houses. Visitors to the shores of the lakes may be
threatened by a flow of sediment rapidly sliding down the slope. Regulatory agencies are left with the responsibility
of establishing setbacks of buildings from the bluff based on historical
erosion rates.
The subject of my Masters research
project is a study of the erosion processes occurring on the shores of Lake
Michigan and Lake Erie for the purpose of predicting the volume of sediment
entering these lakes from the coastal bluffs.
In carrying out the initial stages of this research I became interested
in the mechanisms involved in causing these bluffs to continually to erode.
All potential contributing forces to
bluff erosion are of interest. Known
sources of erosion include the following:
1.Surface Water
Runoff
2.Bluff Slumping
Action
3.Sliding
4.Groundwater
Seepage and Septic Outflow
5.Wind Erosion
6.Rain, Rill and
Gully Erosion
7.Bluff Toe
Erosion Due Wave Attack
The latter point, the wearing away at
the toe of the bluff due to wave action during high wind/storm events, is
considered the dominant contributor to the long-term erosion of the
bluffs. coastalerosion.jpg
Without the wave attack factor, erosion
mechanisms 2 and 3 would occur until the slope of the bluff is “stable” and no
further significant shoreline retreat would be seen. Once this stable configuration is reached, mechanisms 1, 4, 5 and
6 would then be the dominant erosive forces on the stable overall slope. These mechanisms are expected to contribute
less to the long-term total bluff erosion than the wave attack factor
does.
When the waves reach the bluffs, the toe of the slope is eroded by the wave action, thus destabilizing the overall slope. Over time, the slope is destabilized to the point that the down-slope driving forces exceed the resisting forces and a part or the entire slope fails (by slumping or sliding). The destabilization of the bluffs by waves is considered to be the main reason that the bluffs are continuing to recess over hundreds of years’ time. To better understand this process, it is important to understand the properties of the waves that reach the shoreline and to understand how their energy is transformed into such a powerful source of erosion.
The project for which I am currently employed involves six
shoreline study sites. I will
incorporate information from four of these six sites for the purpose of this
project and carry out some more detailed analysis on one of these sites in
particular. The Great Lakes sites
considered for this coastal project include two sites located on the western
shore of Lake Michigan, one near Two Rivers, WI and the other near Port
Washington, WI. A third site is close
to St. Joseph, Michigan on the eastern shore of Lake Michigan. The fourth site is on the southern shore of
Lake Erie near Painesville, Ohio. study_sites.jpg
The troughs of land that are now filled with the waters of the Great Lakes were gouged out by glaciers over a series of ice ages, the most recent of which occurred between 18,000 and 13,000 years ago. As the glaciers retreated, they deposited a layer of glacial till on the land and lake bottom surfaces. The glacial till is made up of an unsorted mix of boulders, cobbles, sand and cohesive particles. The bluff stratigraphy is generally two or more layers of glacial till from one or more glacial advances interlayered with a varved fine sand-silt sequence. The lake bottom consists of a cohesive substrate underlying a veneer of fine to medium sized sand that is continually being reshaped by the wave-induced currents that develop in the surf zone and through turbulence generated by breaking waves. Wave-induced sediment transport occurs both in the on and offshore directions and in the alongshore direction.
The coastal environments of these sites are described in the paragraphs below. Some of the calculations discussed will focus on one the Two Rivers site, the coastal environment of which is described in more detail than the remaining three sites.
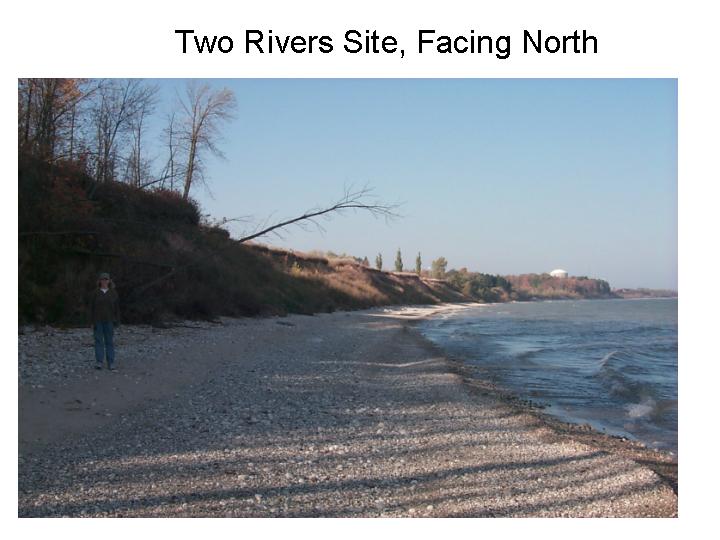
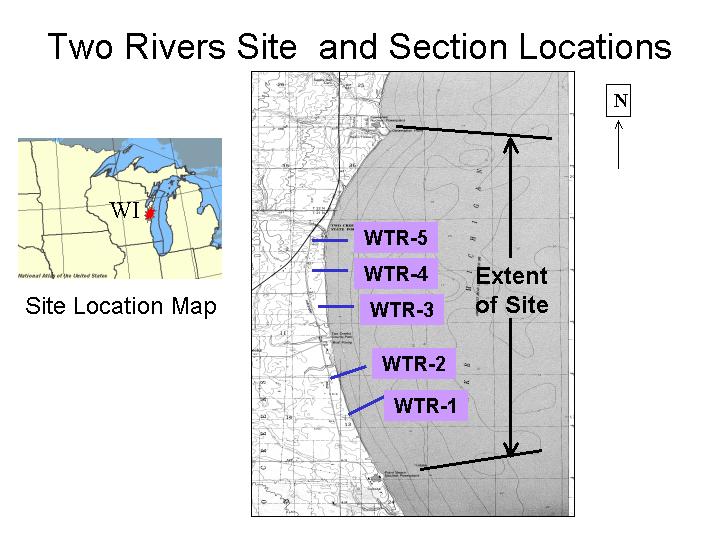
2.1 Two
Rivers, Wisconsin Site
This stretch of coastline is slightly
more than 3 miles long and the shores are relatively sparsely populated. The Kewaunee Nuclear Power Plant is located
at the north end of the site. TR-photo.jpg A wall of rubble mound has been placed at
the base of the bluff from the Kewaunee Plant location to a point approximately
1 mile along the coast to the south.
The Two Creeks Buried State Forest is located one mile south of the
Kewaunee Plant. State Route 42, a major
coastal highway linking the cities of Manitowoc and Kewaunee, passes near the
lakeshore at a location a few hundred feet north of the State Forest. Two Creeks County Park, which includes a
public boat access, is located about 2 miles south of the Kewaunee Plant. At the extreme south end of the site is the
Point Beach Nuclear Power Plant. Both
power plants in the site area likely use lake water as a cooling agent. An intake is shown adjacent to and offshore
from the Point Beach plant. Two_Rivers_map.jpg
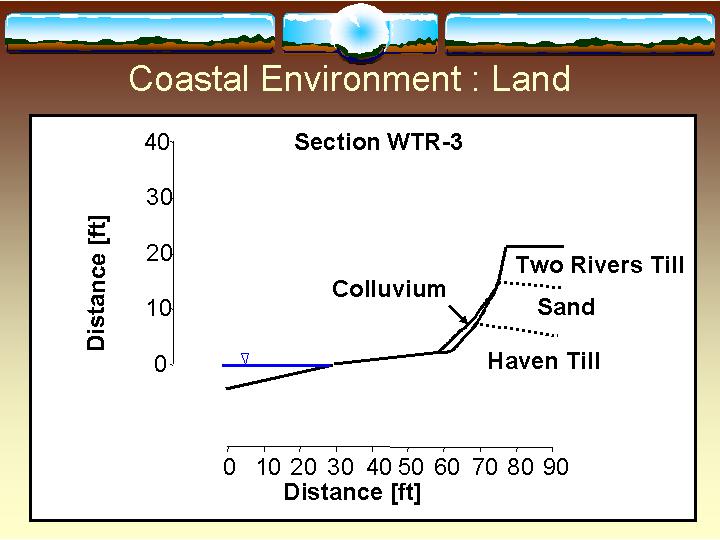
The soil bluffs at the lakeshore
consist of, from top to bottom, desiccated glacial till, fine-grained lake
sediments, and a lower till. The
groundwater table is general situated near the interface between the upper till
and the lake sediments. Two_Rivers_bluff.jpg The bluffs are generally 30 feet high above
beach level, but are as low as 10-20 feet high near the Point Beach Plant. The elevation
contours in the map are referenced to the National Geodetic Vertical Datum of
1929. The soundings shown are in feet
and the datum is a low water level of 576.8 feet.
2.2 Port
Washington, Wisconsin
The bluffs at the Port Washington site
are the highest in the overall study, reaching about 140 ft in height. Failures are large, deep-seated slumps that
are modified by shallow slides and slumps.
Port Washington is populated sparsely and to about the same degree as
the Two Rivers site. Very few coastal
structures are in place along this reach of the coast.
2.3
Painesville, Ohio
The bluffs at Painesville consist
mostly of compact, silty till and thin lake sediment that is being severely
eroded at the base by wave action.
Shallow slides and slumps dominate the present failure mode, although
large slumps have occurred in the recent past and there is potential movement
on these failure surfaces as well.
There is a very limited beach and, in some sections, no beach at
all. This site is the most populated of
the four sites being considered. A
number of coastal structures have been placed at the base of the bluffs to halt
the recession of the coastline. The
dates of installation and nature of the coastal structures are not known at
this time.
2.4
St. Joseph, Michigan
The bluffs at St. Joseph, MI have
historically suffered a great deal of bluff recession. The bluffs reach up to 100 ft in height and
consist mostly of glacial till in the upper part and sand in the lower part of
the slope. In the southern part of the
reach the bluff is entirely sand.
Limited wave erosion at the base still produces some undercutting of the
toe of the slope, although with the present low water conditions most waves are
not extending beyond the revetments, vertical sheet piles or other coastal
structures that are currently in place.
Houses have recently been removed from the bluff top in the central part
of the reach.
3.0
Approaches to the Issues
3.1 Available
Data and Deep Water Wave Characteristics
A number of combined bluff profile survey / bathymetric soundings were carried out on each of the four sites. A survey station was set up on the beach near the base of the bluff. From this vantage point, the offshore surveys could be carried out with the boat always in the sight line of the survey station. Sounding depths were collected, with the still water level being the reference elevation, out to a point 1500 feet or more offshore. The sounding data was collected using a fathometer. The accuracy of the depths is considered to be within about 5 cm. The accuracies of the lateral positioning and vertical sounding depths need to be confirmed.
Offshore wave information is collected
at offshore moored buoy stations. The
information is available on the NOAA website.
A map of the buoys currently in operation is found at:
http://www.ndbc.noaa.gov/stuff/greatlake/grtlmap.shtml.
Of the available wave information that is regularly collected at the moored buoy locations, the summaries of dominant wave period and significant wave height representative of the period spanning July, 1981 to November, 1993 were incorporated this study. Theories relating to wind-generated waves were used to extract peak significant wave height and associated wave period information. The distribution of wave heights generated during a storm has been demonstrated to be well defined by a Rayleigh probability distribution (Sorenson, 1997). Employing this distribution leads to the following relationships
Hs
= 1.416 Hrms
Hmax
= 2.366 Hrms
Where Hs = significant wave
height, usually H33 or average height of highest one third of waves,
and
Hrms = root mean square wave
height
Hmax = maximum wave height
Oschi (1982) recommends the following relationship
between T100, the average period and Tp, the wave period
at the spectral peak) based on empirical wave data:
T100
= 0.77 Tp
The average significant wave height was
based on the 1981-93 wave record summaries.
Since the soundings were carried out in June, the mean wave height data
representing the summer months, April to September, were averaged to compute
the Hs for use in the above relations. The T100 values are the average of the mean dominant
wave periods recorded between April and September.
3.2 Wave
Run-up
Once a wave breaks, it releases some of its contained energy. The remainder of the energy it has will be expressed in its ability to run up the face of the beach and possibly partially up the bluff slope. The run-up is defined as the maximum vertical elevation above the still water level to which the water from the breaking waves rises on the beach or structure. The run-up magnitude is dependent on the wave height and period of incident deep-water waves, the surface slope and profile of the shore and the nearshore, the toe depth, and the roughness and permeability of the slope face.
As the nearshore slope information is
much more detailed where soundings have been carried out, these sections will
be used for the run-up calculations.
The run-up factor, r, discussed in Sorenson (1997), is unknown for a
sandy beach. However, the run-up factor would serve only to reduce the expected
run-up so our calculations yield conservative run-up values. The Hunt and Walton method (Hunt ,1959 and
Walton et al, 1989), the Army Corps of Engineers method were used to confirm
the run-up values obtained from the ACES program available on the Army Corps of
Engineers website. http://chl.wes.army.mil/software/aces/
While the wave run-up is clearly an
important analysis for determining the height of a coastal structure, the
relationship of wave run-up to the attack of the bluffs by waves is not as
clear-cut. It is important to know
whether wave energy with a significant velocity and mass will reach the bluff
at all. However, run-up magnitude
increases as the slope of the beach that intersects the still water line
increases. The steeper the beach is,
the less lateral impact this body of water mass would have. Since there has been insufficient research
to determine the erodibility of the bluffs and the method normalizing of the impact
of the wave arriving at the beach into a primarily destabilizing force is not
well known, the relationship between run-up and bluff recession is not likely
to be a direct one. This is indeed
confirmed by our analysis (see Section 4.0).
3.3 Wave
Impact on Coastal Structures
Waves are commonly the principal source
of loading and sediment transport considered in the design of coastal
structures (Sorensen, 1997). A
significant amount of research has been carried out for the purpose of
designing coastal structures whereas the impact of waves on natural earth
structures, such as till bluffs, is not as well known. There are likely some principles being
applied to coastal structure design that can help us understand the transfer of
wave energy reaching the shore to the destabilization of the till bluffs.
When waves break at a point seaward of
the structure, this structure can be impacted by a force from the surge of
water from the breaking wave. A
conservative assumption proposed by the U.S. Army Coastal Engineering Research
Center (1984) is that the mass of water that surges towards the shore does so
with a velocity equal to the wave celerity at breaking. Assuming the wave breaks under shallow water
conditions,
V = Ögdb
Where db = the depth at
which the wave breaks
V= velocity of
breaking water mass
The vertical thickness of the water mass is assumed to be equal to the crest amplitude at breaking. The water velocity and vertical thickness are assumed to remain constant until reaching the structure or the still water line (whichever comes first). If the structure is located landward of the still water line, the water velocity and vertical thickness are assumed to decrease from the values at the still water line to zero at the hypothetical point of maximum wave run-up (i.e. the maximum run-up that would occur if no structure existed but the beach continued at a constant slope). The kinetic energy of this water mass is converted to a dynamic pressure that acts as a net impact force on the face of the structure.
3.4 Wave
Impact on Coastal Bluffs
The discussion in the Section 3.3
suggests that the energy or energy flux (power) that the wave has upon breaking
is close to the power carried by the wave to the bluff if the bluff is below
the still water level or carried to the beach if the bluff is above the still
water level. Consequently, the position
of the base of the bluff with respect to the still water line has a significant
impact on the degree of influence that the wave energy have on recession
rates. Unfortunately, we do not have
profiles that have been accurately re-surveyed in years of high lake levels and
years of low lake levels or fine enough recession time intervals to observe
first-hand the influence that a changing lake water level has on the rate of
bluff recession. From an observational
standpoint, the best we are able to do to link the wave power and the recession
rate is to use wave data from the same period of time and location to compute a
“representative” peak wave power. We
expect that this representative peak wave power will have a positive
relationship with recession rate. If we
find that this is the case, then we have data that would encourage some more
theoretical studies to be carried out using scale models in a laboratory. Such
studies might enable us to better understand the frictional characteristics of
sand beaches, the erodibility of the bluffs and the effect that the wave power
that arrives at the still water line from the breaking depth has on the bluffs. This is discussed more in Section 6.0.
3.5 Coastal
Zone Processes and Breaking Depth
A beach is continually reshaped as
waves reach the sandy shores of these sites, break and run up the beach/slope
face. Wave-induced currents develop in
the surf zone. The turbulence that is
created as the wave breaks and the mass of water that rushes up and down the
beach face create a never-ending cycle of beach profile change. Sediment is transported both in the
alongshore (parallel to shore) and cross-shore (perpendicular to shore)
directions.
The zone of active coastal processes
extends from an onshore landmark to a point offshore where there is little
significant wave-induced sediment transport.
For the open ocean, this point occurs at a depth of about 10 meters’
depth (Sorensen, 1997). From the base
of the bluff towards the water, up to two flat berms, representative of the
winter and summer depositional conditions (in that order), often can be seen on
the beach. In the nearshore zone, the
profile is generally concave in profile.
During a long period of relatively calm wave action, the foreshore is
nourished by sand sediment and the point at which the still water line meets
the beach moves seaward. The slope of
the profile in the foreshore during a calm period is steeper than the slope in
the foreshore following a period of storm wave action. Steep, high storm waves transport the sand
in a seaward direction. This results in
a flatter slope profile that extends farther up the beach than the calm
condition profile.
The sand that is transported offshore
during storm conditions builds up a prominent offshore bar at the location
where the waves are breaking. As the
waves become higher the bar will move seaward and the size of the bar will
grow. The onset of lower energy waves
may trap the deep-water bar and start forming a new, smaller bar closer to the
shore. During extremely low wave
conditions no bars are built.
From the above discussion, a great deal
can be learned about the incident wave characteristics from the nature of the
beach profile. To confirm the wave
characteristics that are calculated based on the procedure outlined in Section
3.1, we can determine the expected breaking depth and compare this with the
measured depth of the bar based on our surveyed profiles. The breaking depth can be determined from
empirical curves developed from a number of experiments that have been done to
investigate nearshore breaking conditions in the laboratory. Figures 2.11 and 2.12 in Sorensen (1997) are
commonly used for estimating breaking conditions. Figure 2.11 correlates dimensionless breaker height, Hb/Ho’
to deep water steepness, Ho’/gT2 for varying bottom
slopes. Once the breaker height is
known, Figure 2.12 can be used to determine the breaker depth, given the bottom
slope and breaker steepness.
3.6 Wave
Power
Wave power is the wave energy per unit
time transmitted in the direction of wave propagation. As this study does not consider the dominant
wind direction of the waves incident to the shorelines of these sites, the
waves are considered to be propagating normal to the shoreline. The general expression for wave power
derived in Sorensen, 1997 is:
P = nE/T
Where P = power in Watts/m
n = 1 for
shallow water waves
E
= total kinetic and potential wave energy, in Joules/m
T
= wave period in sec.
For shallow water waves, the above
expression becomes:
P = rgH2Lo/8T
Where r = density of water, 1000 kg/m3
g
= acceleration due to gravity, 9.81 m/s2
Lo = wave length in meters
The power was determined for waves
approaching the shore at the breaking depth.
Since the waves at the breaking depths are shallow water waves, the wave
length, Lo is calculated using the deep water wave length formula as
follows:
Lo
= gT2/2p
3.7 Bluff
Recession
The positions of the top and bottom of
the bluffs have been mapped from airphotos taken in 1996 of the Two Rivers
Site. Airphotos taken in 1952 were used
for mapping the position of the top of the bluff, but were not of sufficiently
good quality for locating the bottom of the bluff. The change in position from the 1952 top-of-bluff position to the
1996 top-of-bluff position will be used to estimate the magnitude of bluff top
recession across the site for this 44-year period. As the lines were drawn from photos taken from high-flying
aircrafts, the accuracy of their position will likely not be greater than about
5-10 feet. The bluff positions have
been digitized into ArcView format using the Wisconsin coordinate system-south zone projection. The locations of the nearshore sounding
profiles were converted from latitude and longitude to northing and easting
values in the Wisconsin coordinate system in order to
determine the recession rate at the positions of the profiles.
4.0 Results
This section provides the results of the analyses described in Section 3.0.
4.1
Deep Water Wave Characteristics
Of the moored buoy stations shown on the NOAA website (see Section 3.1), Stations 45002 and 45007 (Lake Michigan) and 45005 (Lake Erie) were of use for this study. Table 4.1 summarizes the station location, the coastal site for which the station’s information was used and the pertinent deep water wave characteristics.
Table 4.1 Moored Buoy Stations and Deep Water Wave Characteristics for April-Sept.
|
Station à |
45002 |
45007 |
45005 |
|
Website of buoy |
http://www.ndbc.noaa.gov/station_page.phtml?$station=45007 |
||
|
Location |
51 NM Northeast of Sturgeon Bay, WI |
43 NM East Southeast of Milwaukee, WI |
28 NM Northwest of Cleveland, OH |
|
Water Depth |
174.4 m |
164.6 m |
14.6 m |
|
Site Data Used For |
Two Rivers, WI |
Port Washington, WI St. Joseph, MI |
Painesville, OH |
|
T100 |
3.65 s |
3.72 s |
3.22 s |
|
Hs |
0.58 m |
0.58 m |
0.50 m |
|
Hrms |
0.41m |
0.41 m |
0.35 m |
|
Hmax |
0.98 m |
0.98 m |
0.84 m |
|
Tp |
4.74 s |
4.83 s |
4.18 s |
4.2
Breaking Depth – Calculated And Observed
The breaking depths were calculated for each of the four sites given the wave information provided in Table 4.1. The results are shown in Table 4.2. The wave breaking slope, m, is the slope (i.e. the tangent of the slope off the horizontal) approaching the most prominent offshore bar from the seaward direction.
Table 4.2 Calculated Breaking Height and Breaking Depth and Measured
Breaking Depth
|
Site |
Wave
Breaking Slope, m – average of profiles |
Calculated
Breaking Height, Hb [m] |
Calculated
Breaking Depth, db [m] |
Average of
Measured Breaking Depth [m] |
|
Two Rivers, WI |
0.018 |
1.1 |
4.2 |
4.1 |
|
Port Washington, WI |
0.021 |
1.1 |
4.1 |
4.5 |
|
St. Joseph, MI |
0.031 |
1.2 |
4.2 |
8.9 |
|
Painesville, OH |
0.023 |
0.9 |
3.4 |
9.3 |
A plot of the
calculated breaking depths versus the measured breaking depths as shown in
Table 4.2 is attached. Bar_Depth_vs_Breaking_Depth.jpg
4.3
Wave Run-up
Despite the uncertain correlation of run-up with recession rate, the run-up was calculated at with the interest of at least finding out whether or not the waves reach the base of the bluff under high-energy conditions at the current lake levels. For the Painesville site, the run-up was calculated using the Hunt and Walton method (Hunt ,1959 and Walton et al, 1989), and U.S. Army Corps of Engineers methods as well as the ACES program. This was done to verify the ACES program results. Once it became clear that the program produced consistent run-up values, the ACES program was used to calculate run-up for the Two Rivers and Port Washington sites. As the nearshore conditions at St. Joseph were not amenable to wading survey profiling, the beach slopes were not obtained for the site. The Port Washington profiles were not analyzed. Table 4.3 summarizes the run-up analyses. The run-up slope is the tangent of the angle of the beach slope where it intersects the still water line.
Table 4.4. Run-up Results
|
Site |
Profile |
Run-up Slope |
Predicted Runup [Hunt and Walton] [m] |
Predicted Run-Up [U.S. Army Corps of Engineers] [m] |
Average Run-up from ACES program [m] |
|
Two Rivers, WI |
WTR-1 |
0.009 |
|
|
0.55 |
|
|
WTR-2 |
0.098 |
|
|
0.60 |
|
|
WTR-3 |
0.123 |
|
|
0.70 |
|
|
WTR-4 |
0.133 |
|
|
0.73 |
|
|
WTR-5 |
0.130 |
|
|
0.72 |
|
Painesville, OH |
P-4 |
0.150 |
0.72 |
0.92 |
0.66 |
|
|
P-5 |
0.053 |
0.26 |
0.39 |
0.32 |
|
|
P-6 |
0.047 |
0.22 |
0.33 |
0.30 |
|
|
P-7 |
0.136 |
0.65 |
0.80 |
0.62 |
|
|
P2610 |
0.051 |
0.24 |
0.35 |
0.31 |
|
|
P-8 |
0.075 |
0.36 |
0.44 |
0.41 |
The wave run-up is plotted against run-up slope in the attached figure. Two_Rivers_Run-up.jpg
4.4
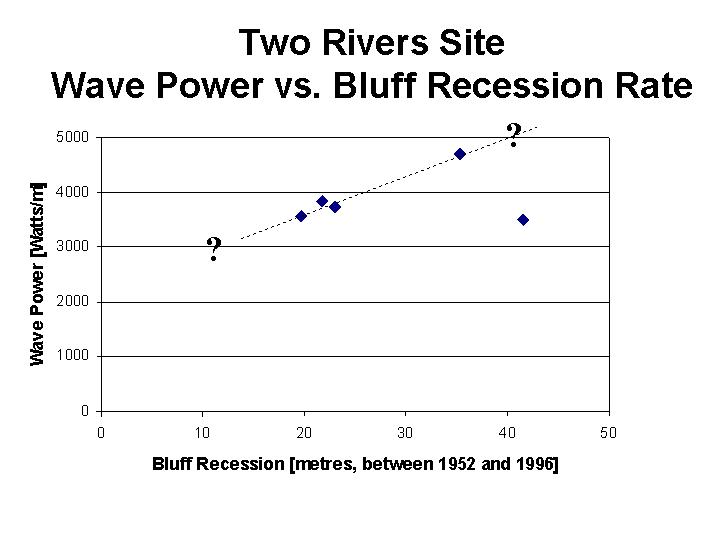
Wave Power and Bluff Recession
The wave power at the breaking wave
location was calculated for the five profiles of the Two Rivers Site. The wave power and recession of the top of
the bluff between 1952 and 1996 are summarized in Table 4.5.
Table 4.5 Wave Power and Recession Rates for Two Rivers, WI profiles.
|
Profile |
Wave Power [Watts/m] |
Recession of
Top of Bluff between 1952 and 1996 [m] |
|
WTR-1 |
4,694 |
35 |
|
WTR-2 |
3,498 |
42 |
|
WTR-3 |
3,848 |
22 |
|
WTR-4 |
3,556 |
20 |
|
WTR-5 |
3,724 |
23 |
A plot of wave power versus recession rate for the five Two Rivers profiles is attached. TR_Power_vs_Recesion.jpg
5.0
Discussions
As stated in Section 3.1, the deep-water wave characteristics are taken from summaries of data collected at offshore moored buoys. It is not known how long these buoys have been in place, but the wave data summaries are only provided for the time period between 1981 and 1993. This is a much shorter time period than the time span for which recession rates are given. If use of the wave data summary is valid for calculations like the ones carried out for this study, the dates between which recession has been measured should match the dates between which wave data is collected to obtain truly representative wave characteristics. Unfortunately, wave data has only been collected for about the last 30 years.
Relationships derived from the Rayleigh probability distribution for storm wave heights were used to calculate the peak wave height from the mean significant wave height. The mean significant wave heights used were an average of the mean monthly values between April and September based on the wave summaries. The use of the Rayleigh probability distribution requires that the wave spectrum has a single narrow band of frequencies and that the individual waves are randomly distributed. This distribution has been found to be acceptably close to distributions created based on observed wave heights during storms. However, the wave height summary contains storm and non-storm wave data. The distribution of all wave heights between 1981 and 1993 may not be well represented by a Rayleigh distribution. Moreover, the narrow band of frequency criterion may not be satisfied by the wave data used for the summary. The recommended empirical relations between the average and the peak dominant wave periods has not been verified by site-specific data.
Despite the above limitations on our deep-water wave properties, the calculated breaking depths agree very well with measured bar depths. The calculated breaking depths came within 0.4 meters of the average measured depths of the longshore bars for both Wisconsin sites. For the St. Joseph, MI and Painesville, OH sites the 1999 measured bar depths were just over twice the calculated breaking depths. These two sites are much more developed than both Wisconsin sites. At the St. Joseph site, vertical sheet piling has been placed below the beach around the still water level to prevent further bluff recession. Shore-parallel onshore structures impact littoral processes in two ways. By preventing erosion of the shore, the source of sediment for longshore transport is reduced. If such structures are installed seaward of the water line, the size and transport capacity of the surf zone will be reduced unless the increased agitation in the surf zone due to the structure counteracts this effect. Due to the existence of these coastal structures, we would expect higher incident wave reflection coefficients and a modified breaking wave criteria. If a partially standing wave develops at these structures, the breaking depth would be twice that expected of a progressive wave. If we double the calculated breaking depths given for St. Joseph and Painesville in Table 4.2, the values come very close to the observed bar depths.
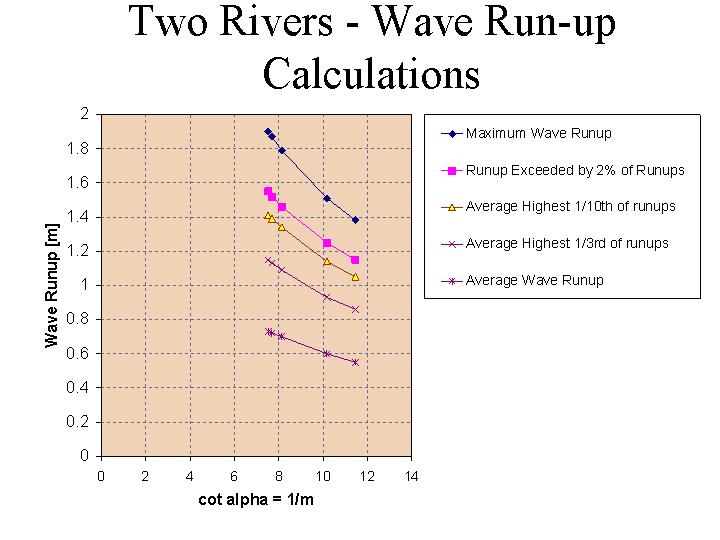
Wave run-up was calculated based on the
Hunt and Walton Method and the Army Corps of Engineers’ method. The calculated values were compared to the
output from the ACES program. Given the
beach slope and the incident deep-water wave height and wave period, the ACES
program provides:
Ø
The Maximum Wave Run-up,
Ø
The Run-up Exceeded by 2% of the Run-up,
Ø
The Average Highest 1/10th of Run-ups,
Ø
The Average Highest 1/3rd of Run-ups, and
Ø
The Average Wave Run-up.
Of these five run-up values, the
average wave run-up from the ACES program comes the closest to the values
obtained from using the Hunt and Walton and the Army Corps of Engineers
methods. This is the reason only the
average wave run-up is reported on Table 4.4.
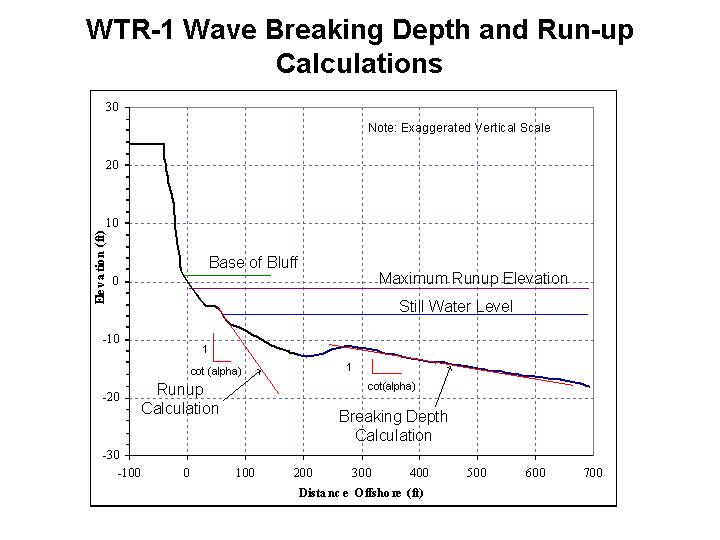
Further to the discussion in Section 3.2, however, the maximum wave
run-up can indicate whether or not the waves reach the bluff under the current
still water level. From the attached
figure that shows Two Rivers section WTR-1, (WTR-1_profile.jpg) including
the base of the bluff and the maximum run-up elevation, it is clear that the
maximum run-up does not currently reach the base of the bluffs.
Since run-up is a function of the slope
geometry, the position of the still water line with respect to the bluffs, the
grain size distribution of the beach slope as well as the incident wave
characteristics, it is difficult to determine a “representative” run-up for a
30-year time period. Over the past 30
years the lake levels have fluctuated dramatically and the slope profiles have
changed. Moreover, there is currently
no clear way to relate the run-up to the erosion of the bluffs over time. Actually, the calculated run-ups are greater
for the steeper sloped beaches (i.e. calm wave conditions) than for the shallow
sloped beaches that are more representative of erosive, high-energy wave conditions. Higher recession rates have been observed
for the shallow sloping beaches than for the profiles with steeper
beaches. This suggests that there may
be somewhat of an inverse relationship between wave run-up and recession, but
more research needs to be carried out on this subject before any such
generalizations can be made.
The wave power – bluff recession plot based on the five Two Rivers profiles and wave data (see Section 4.4) shows encouraging results. We would expect the incident wave power to be related to the ability of the waves to erode the shoreline, and our preliminary analysis shows that the rate of recession generally increases as the power of the incident waves increase. The outlier on this graph may be explained by a discrepancy between the two types of nearshore profiling surveys. One of the surveys involved wading out into the water from the beach and taking depth readings. A second survey was carried out from a boat. These two profiles mesh very well for profile WTR-1, but do not agree very well in profiles WTR-2, WTR-3, WTR-4 and WTR-5. Profiles WTR-1 and WTR-2 show, by far, the greatest degree of recession over the 44-year period measured. The top of the bluff has retreated by 35 and 42 ft for WTR-1 and WTR-2 respectively. The remaining three profiles have shown 20-23 feet of recession. The crest of the prominent longshore bar on profile WTR-1 is located about 280 feet from the base of the bluff and 5.4 feet below still water level. A slightly less prominent longshore bar is located at the same distance offshore from the bluff in profile WTR-2 but only 3 feet below the still water level. Consequently, the calculated wave power at WTR-2 is significantly less than the wave power at WTR-1. Profiles WTR-3, WTR-4 and WTR-5 show bars located about 125 feet offshore and at depths between 3.1 and 3.6 ft below still water level. The lateral position of the bar in WTR-1 suggests higher wave power than these profiles. It is hoped that this years’ surveys of the same profiles will clear up this discrepancy.
6.0
Future Work
The following paragraphs outline the
future work needed for this study and considerations for future studies of this
nature. Sediment samples have been
collected at points of increasing depth in the nearshore zone. It would be interesting to compare the grain
size distributions of these samples with the positions in the cross-shore
profiles from which the samples were taken.
We would expect samples retrieved from the breaking depth position to be
representative of a higher energy condition and therefore have greater grain
sizes than samples retrieved from the small “basins” we see immediately in
front of the bars on the landward side.
As stated in Section 3.6, the
predominant wind direction is not taken into account in any of the calculations
but most notably for the wave power calculations. The waves were assumed to progress normal to the shoreline at
every profile location. We know that
this is not really the case. For
example, the winds are mainly from the North and Northeast at the Two Rivers
site. Taking into account this wind
factor, the closer the wind direction is to a shore-normal orientation, the
higher the percentage of wave power that will reach the beach and have potential
to destabilize the bluffs. As wind data
is collected at NOAA’s moored buoys, the information is available to make such
wind direction-correction to wave power.
The accuracy the nearshore profiles
need to be improved. The longshore bars
often are situated where the wading survey and boat survey overlap and there is
often a discrepancy between the depth of the bar based on the two surveys. It is hoped that this year’s surveys will be
of improved quality. The accuracy of
the sounding equipment should be verified.
The observations that we have made
suggest the need for more data to include on the wave power-recession
plot. If several sites’ data are
including on such a plot, we will be able to make some initial judgements on
how site-specific the relationship is and whether or not the relationship holds
for a number of coastal settings.
There is also a need to improve our
assessments of the wave characteristics representative of the time period over
which we have bluff recession data. The
wind-generated wave theories used are based on storm events and may not apply
for wave data averaged over storm and non-storm periods.
There is a possibility that some
additional wave data-collecting offshore buoys are located closer to our
sites. If this is the case, data from
closer locations would improve our estimates of the deep water wave
characteristics for use in calculating the wave power.
7.0
References
http://www.co-ops.nos.noaa.gov/
5. Oschi, M.K. (1982), “Stochastic Analysis and
Probabilistic Prediction of Random Seas,” Advances in Hydroscience, Vol.
13, pp. 218-375