
The above graph is the output of the Ncomponent program, written by professor Wu. It represents an average of three trials using 500 readings at 2 minute intervals. It uses a Fourier Transform function in MATLAB to plot all of the frequencies (x-axis) that have occurred in the data series, along with the amplitudes (y-axis) that correspond. The frequency that will be focussed on here is amplified below:

This frequency corresponds to a period of about 26 minutes (Within the spectrum of Sieching). Using the equation for closed basin and assuming a mean depth of 42 ft. , a maximum width ~ 27000 ft and a maximum length of ~ 43000 ft. (N,M=.5)
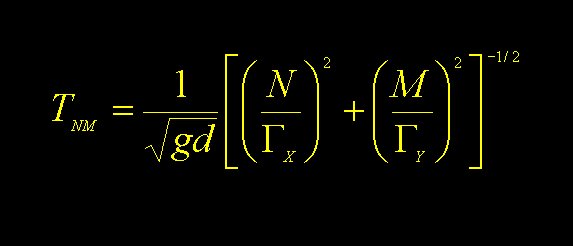
T=
21 minutes
The discrepancy here is due to the fact :
1. That Lake Mendota is not a vertically sided basin. This is assumed for the calculation thereby neglecting the effects of bottom contours. This assumption of the wave at uniform propagation would would decrease the period of the wave, and be in agreement with this discrepancy.
2. Lake Mendota is not really a closed basin. This equation assumes the behavior of the basin is not open to outside sources or sinks. In actuality, the Yahara River flows in and out of Lake Mendota causing an increase in the period of the wave.